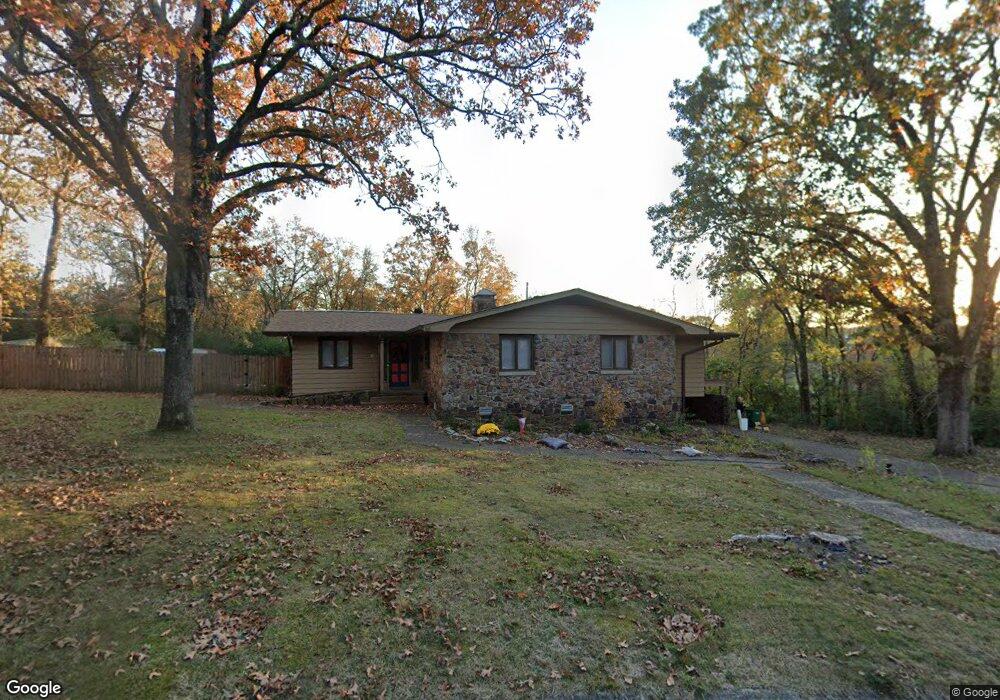
35 Wesley Dr Sherwood, AR 72120
Estimated Value: $269,000 - $452,000
--
Bed
4
Baths
3,812
Sq Ft
$97/Sq Ft
Est. Value
About This Home
This home is located at 35 Wesley Dr, Sherwood, AR 72120 and is currently estimated at $370,394, approximately $97 per square foot. 35 Wesley Dr is a home located in Pulaski County with nearby schools including Oakbrooke Elementary School, Sylvan Hills Middle School, and Sylvan Hills High School.
Ownership History
Date
Name
Owned For
Owner Type
Purchase Details
Closed on
Nov 25, 2024
Sold by
Wood Clark B and Wood Michelle A
Bought by
Clark Bennett Wood And Michelle Ann Wood Livi and Wood
Current Estimated Value
Purchase Details
Closed on
Aug 20, 2018
Sold by
Wood Michelle A and Wood Clark B
Bought by
Wood Michelle A and Wood Clark B
Purchase Details
Closed on
Sep 1, 2015
Sold by
Sullivan Sallie R and Wood Michelle A
Bought by
Wood Michelle A
Purchase Details
Closed on
Jul 24, 2003
Sold by
Armbrust Mildred L
Bought by
Wood Michelle Ann and Armbrust Michael Allen
Purchase Details
Closed on
Jan 20, 2003
Sold by
Armhurst Michael Allen and Wood Michelle Ann
Bought by
Armburst Mildred L
Purchase Details
Closed on
Jan 9, 2003
Sold by
Armbrust Mildred L
Bought by
Armbrust Michael Allen and Wood Michelle Ann
Create a Home Valuation Report for This Property
The Home Valuation Report is an in-depth analysis detailing your home's value as well as a comparison with similar homes in the area
Home Values in the Area
Average Home Value in this Area
Purchase History
| Date | Buyer | Sale Price | Title Company |
|---|---|---|---|
| Clark Bennett Wood And Michelle Ann Wood Livi | -- | None Listed On Document | |
| Clark Bennett Wood And Michelle Ann Wood Livi | -- | None Listed On Document | |
| Wood Michelle A | -- | None Available | |
| Wood Michelle A | -- | Attorney | |
| Wood Michelle Ann | -- | -- | |
| Armburst Mildred L | -- | -- | |
| Armbrust Michael Allen | -- | -- |
Source: Public Records
Tax History Compared to Growth
Tax History
| Year | Tax Paid | Tax Assessment Tax Assessment Total Assessment is a certain percentage of the fair market value that is determined by local assessors to be the total taxable value of land and additions on the property. | Land | Improvement |
|---|---|---|---|---|
| 2025 | $2,612 | $62,726 | $13,800 | $48,926 |
| 2024 | $2,411 | $62,726 | $13,800 | $48,926 |
| 2023 | $2,411 | $62,726 | $13,800 | $48,926 |
| 2022 | $2,494 | $62,726 | $13,800 | $48,926 |
| 2021 | $2,231 | $51,580 | $11,700 | $39,880 |
| 2020 | $2,097 | $51,580 | $11,700 | $39,880 |
| 2019 | $1,963 | $51,580 | $11,700 | $39,880 |
| 2018 | $1,829 | $51,580 | $11,700 | $39,880 |
| 2017 | $1,695 | $51,580 | $11,700 | $39,880 |
| 2016 | $1,561 | $45,240 | $10,800 | $34,440 |
| 2015 | $1,187 | $23,367 | $10,800 | $12,567 |
| 2014 | $1,187 | $23,367 | $10,800 | $12,567 |
Source: Public Records
Map
Nearby Homes
- 59 Wesley Dr
- 9125 Woodbine St
- 9318 Woodbine Sttreet
- 208 E Kiehl Ave Unit out parcel
- 00 E Kiehl Ave
- 616 E Woodruff Ave
- 1109 Brice Rd
- 14 Pamela Ln
- 00 Highway 107
- 1300 E Maryland Ave
- 135 W Lee Ave
- 8320 Holiday Dr
- 9016 Wilhite Ln
- 8602 Patricia Lynn Ln
- 222 Gragson Ave
- 109 Pamela Ln
- 111 Pamela Ln
- 9460 Robin Ln
- 8921 Claremont Ave
- 8109 Oak Ridge Rd