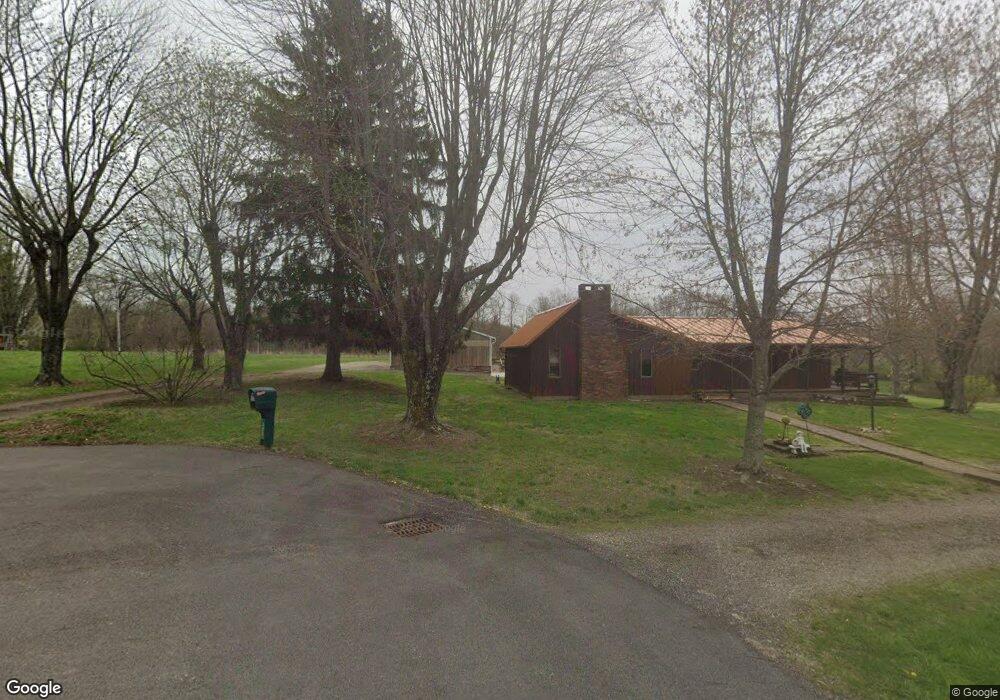
350 Marsha Ln Zanesville, OH 43701
Estimated Value: $375,000 - $547,887
2
Beds
3
Baths
1,620
Sq Ft
$270/Sq Ft
Est. Value
About This Home
This home is located at 350 Marsha Ln, Zanesville, OH 43701 and is currently estimated at $436,962, approximately $269 per square foot. 350 Marsha Ln is a home located in Muskingum County with nearby schools including Perry Elementary School, East Muskingum Middle School, and Larry Miller Intermediate Elementary School.
Ownership History
Date
Name
Owned For
Owner Type
Purchase Details
Closed on
Aug 28, 2025
Sold by
Graham Mary Ann
Bought by
Klc Revocable Trust and Castor
Current Estimated Value
Purchase Details
Closed on
Jan 2, 2024
Sold by
Graham Timothy A and Graham Mary Ann
Bought by
Graham Timothy A and Graham Mary Ann
Purchase Details
Closed on
Jul 21, 2011
Sold by
Graham Virgil R
Bought by
Graham Timothy A and The Virgil R Graham Keystone Inheritance
Purchase Details
Closed on
Jun 9, 2011
Sold by
Graham Virgil R
Bought by
Graham Timothy A
Purchase Details
Closed on
Apr 28, 2009
Sold by
Graham Virgil R
Bought by
Graham Virgil R and The Graham Family Credit Shelter Trust
Purchase Details
Closed on
Jul 8, 1994
Sold by
Graham Iva L and Graham Virgil R
Bought by
Graham Iva L and Graham Virgil R
Create a Home Valuation Report for This Property
The Home Valuation Report is an in-depth analysis detailing your home's value as well as a comparison with similar homes in the area
Home Values in the Area
Average Home Value in this Area
Purchase History
| Date | Buyer | Sale Price | Title Company |
|---|---|---|---|
| Klc Revocable Trust | $18,000 | None Listed On Document | |
| Graham Timothy A | -- | None Listed On Document | |
| Graham Timothy A | -- | None Listed On Document | |
| Graham Timothy A | -- | Attorney | |
| Graham Timothy A | -- | Attorney | |
| Graham Timothy A | -- | Attorney | |
| Graham Timothy A | -- | Attorney | |
| Graham Virgil R | -- | Attorney | |
| Graham Virgil R | -- | None Available | |
| Graham Iva L | -- | Attorney |
Source: Public Records
Tax History Compared to Growth
Tax History
| Year | Tax Paid | Tax Assessment Tax Assessment Total Assessment is a certain percentage of the fair market value that is determined by local assessors to be the total taxable value of land and additions on the property. | Land | Improvement |
|---|---|---|---|---|
| 2024 | $5,351 | $145,145 | $72,730 | $72,415 |
| 2023 | $6,821 | $107,310 | $49,560 | $57,750 |
| 2022 | $2,371 | $105,105 | $51,590 | $53,515 |
| 2021 | $2,344 | $105,105 | $51,590 | $53,515 |
| 2020 | $2,279 | $95,585 | $46,900 | $48,685 |
| 2019 | $2,268 | $95,585 | $46,900 | $48,685 |
| 2018 | $1,215 | $98,630 | $46,900 | $51,730 |
| 2017 | $2,065 | $88,970 | $46,900 | $42,070 |
| 2016 | $2,068 | $88,970 | $46,900 | $42,070 |
| 2015 | $2,120 | $88,970 | $46,900 | $42,070 |
| 2013 | $2,055 | $88,970 | $46,900 | $42,070 |
Source: Public Records
Map
Nearby Homes
- 400 Spring Valley Dr
- 130 Airport Rd
- 310 Trappers Hollow Rd
- 5180 Pine Valley Dr
- 6265 Canterbury Way Unit LOT 30
- 4460 East Pike
- 365 Walters Way
- 360 Walters Way
- 6600 Bridgeville Dr
- 1305 Bald Hill Rd
- 7115 East Pike
- 350 Urban Hill Rd
- 0 Sonora Rd Unit 225018643
- 0 Sonora Rd Unit 5125925
- 380 Urban Hill Rd
- 0 E Wheeling Rd Unit 5162172
- 1605 Jackson Rd
- 3620 Old Wheeling Rd
- 7915 East Pike
- 2125 Long Rd
- 330 Marsha Ln
- 335 Marsha Ln
- 355 Marsha Ln
- 320 Marsha Ln
- 325 Marsha Ln
- 310 Marsha Ln
- 315 Marsha Ln
- 370 Spring Valley Dr
- 360 Spring Valley Dr
- 380 Spring Valley Dr
- 350 Spring Valley Dr
- 340 Spring Valley Dr
- 5290 Airwood Dr
- 390 Spring Valley Dr
- 300 Marsha Ln
- 5270 Airwood Dr
- 390 Spring Valley Rd
- 410 Spring Valley Dr
- 330 Spring Valley Dr
- 5240 Airwood Dr