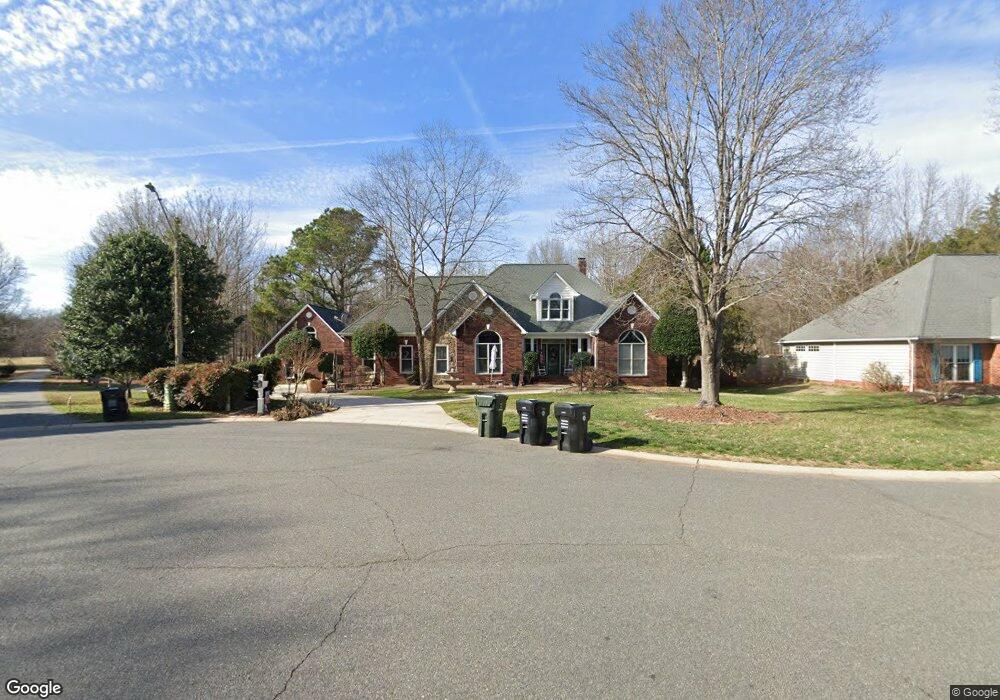
3505 Cedar Springs Dr SW Concord, NC 28027
Estimated Value: $446,000 - $658,000
3
Beds
2
Baths
2,671
Sq Ft
$211/Sq Ft
Est. Value
About This Home
This home is located at 3505 Cedar Springs Dr SW, Concord, NC 28027 and is currently estimated at $563,047, approximately $210 per square foot. 3505 Cedar Springs Dr SW is a home located in Cabarrus County with nearby schools including Wolf Meadow Elementary School, Roberta Road Middle School, and Jay M. Robinson High School.
Ownership History
Date
Name
Owned For
Owner Type
Purchase Details
Closed on
Sep 25, 2013
Sold by
Morgan Ben and Morgan Catherine
Bought by
Rizk Victor and Rizk Claudia
Current Estimated Value
Home Financials for this Owner
Home Financials are based on the most recent Mortgage that was taken out on this home.
Original Mortgage
$304,385
Outstanding Balance
$219,733
Interest Rate
3.75%
Mortgage Type
FHA
Estimated Equity
$343,314
Purchase Details
Closed on
Nov 12, 2010
Sold by
Miller John C and Miller Francie H
Bought by
Morgan Ben and Morgan Catherine
Home Financials for this Owner
Home Financials are based on the most recent Mortgage that was taken out on this home.
Original Mortgage
$306,787
Interest Rate
2.87%
Mortgage Type
FHA
Purchase Details
Closed on
Oct 12, 2007
Sold by
Huneycutt Daniel Ray and Huneycutt Angela D
Bought by
Miller John C and Miller Francie H
Purchase Details
Closed on
Jan 14, 1998
Sold by
The Creekwood Group Inc
Bought by
Huneycutt Daniel Ray and Huneycutt Angela D
Purchase Details
Closed on
Oct 1, 1996
Bought by
Huneycutt Daniel Ray
Create a Home Valuation Report for This Property
The Home Valuation Report is an in-depth analysis detailing your home's value as well as a comparison with similar homes in the area
Home Values in the Area
Average Home Value in this Area
Purchase History
| Date | Buyer | Sale Price | Title Company |
|---|---|---|---|
| Rizk Victor | $310,000 | Investors Title Insurance Co | |
| Morgan Ben | $327,500 | Investors Title Insurance Co | |
| Miller John C | $350,000 | None Available | |
| Huneycutt Daniel Ray | $50,000 | -- | |
| Huneycutt Daniel Ray | $200,000 | -- |
Source: Public Records
Mortgage History
| Date | Status | Borrower | Loan Amount |
|---|---|---|---|
| Open | Rizk Victor | $304,385 | |
| Previous Owner | Morgan Ben | $306,787 |
Source: Public Records
Tax History Compared to Growth
Tax History
| Year | Tax Paid | Tax Assessment Tax Assessment Total Assessment is a certain percentage of the fair market value that is determined by local assessors to be the total taxable value of land and additions on the property. | Land | Improvement |
|---|---|---|---|---|
| 2025 | $5,561 | $558,290 | $80,000 | $478,290 |
| 2024 | $5,561 | $558,290 | $80,000 | $478,290 |
| 2023 | $4,649 | $381,060 | $45,000 | $336,060 |
| 2022 | $4,649 | $381,060 | $45,000 | $336,060 |
| 2021 | $4,649 | $381,060 | $45,000 | $336,060 |
| 2020 | $4,649 | $381,060 | $45,000 | $336,060 |
| 2019 | $3,878 | $317,870 | $30,000 | $287,870 |
| 2018 | $3,814 | $317,870 | $30,000 | $287,870 |
| 2017 | $3,751 | $317,870 | $30,000 | $287,870 |
| 2016 | $2,225 | $325,790 | $30,000 | $295,790 |
| 2015 | $3,844 | $325,790 | $30,000 | $295,790 |
| 2014 | $3,844 | $325,790 | $30,000 | $295,790 |
Source: Public Records
Map
Nearby Homes
- 3811 Bent Creek Dr SW
- 3807 Bent Creek Dr SW
- 4370 Coddle Creek Dr
- 3141 Yates Mill Dr SW
- 3455 Roberta Rd
- 3333 Roberta Rd
- 3369 Roberta Rd
- 3913 Stough Rd
- 4349 Roberta Rd
- 4114 Carolina Pointe Ct SW
- 4112 Alexis Ct SW
- 3133 Roberta Rd
- 287 Halton Crossing Dr SW
- 4104 Pebblebrook Cir SW
- 4110 Pebblebrook Cir SW
- 706 King Fredrick Ln SW
- 193 Halton Crossing Dr SW
- 3011 Langhorne Ave SW
- 4178 Morris Burn Dr SW
- 3673 Farm Lake Dr SW
- 3509 Cedar Springs Dr SW
- 3513 Cedar Springs Dr SW
- 3508 Cedar Springs Dr SW
- 3504 Cedar Springs Dr SW
- 3512 Cedar Springs Dr SW
- 3517 Cedar Springs Dr SW
- 3503 Cedar Springs Dr SW
- 3516 Cedar Springs Dr SW
- 3521 Cedar Springs Dr SW
- 3520 Cedar Springs Dr SW
- 3524 Cedar Springs Dr SW
- 3525 Cedar Springs Dr SW
- 3501 Cedar Springs Dr SW
- 000 Glen Haven Dr SW
- 3528 Cedar Springs Dr SW
- 3529 Cedar Springs Dr SW
- 3532 Cedar Springs Dr SW
- 3499 Cedar Springs Dr SW
- 3536 Cedar Springs Dr SW
- 3533 Cedar Springs Dr SW