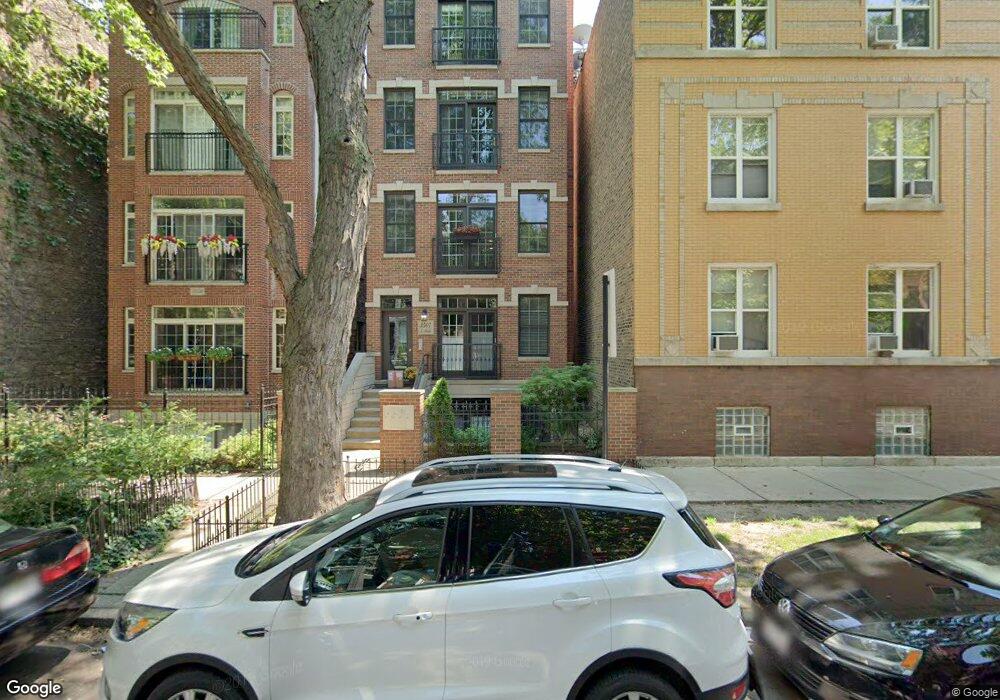
3507 N Reta Ave Unit 2 Chicago, IL 60657
Lakeview East NeighborhoodEstimated Value: $579,000 - $624,000
2
Beds
2
Baths
1,400
Sq Ft
$425/Sq Ft
Est. Value
About This Home
This home is located at 3507 N Reta Ave Unit 2, Chicago, IL 60657 and is currently estimated at $595,363, approximately $425 per square foot. 3507 N Reta Ave Unit 2 is a home located in Cook County with nearby schools including Nettelhorst Elementary School, Lake View High School, and Bernard Zell Anshe Emet Day School.
Ownership History
Date
Name
Owned For
Owner Type
Purchase Details
Closed on
Dec 27, 2011
Sold by
Frendian Michel
Bought by
Frendian Michel and Michel Frendian Living Trust
Current Estimated Value
Home Financials for this Owner
Home Financials are based on the most recent Mortgage that was taken out on this home.
Original Mortgage
$350,874
Outstanding Balance
$244,469
Interest Rate
4.4%
Mortgage Type
FHA
Estimated Equity
$350,894
Purchase Details
Closed on
Dec 6, 2011
Sold by
Fisher Shane
Bought by
Frendian Michel
Home Financials for this Owner
Home Financials are based on the most recent Mortgage that was taken out on this home.
Original Mortgage
$350,874
Outstanding Balance
$244,469
Interest Rate
4.4%
Mortgage Type
FHA
Estimated Equity
$350,894
Purchase Details
Closed on
Sep 20, 2004
Sold by
3507 Reta Llc
Bought by
Fisher Shane
Home Financials for this Owner
Home Financials are based on the most recent Mortgage that was taken out on this home.
Original Mortgage
$340,000
Interest Rate
4.62%
Mortgage Type
New Conventional
Create a Home Valuation Report for This Property
The Home Valuation Report is an in-depth analysis detailing your home's value as well as a comparison with similar homes in the area
Home Values in the Area
Average Home Value in this Area
Purchase History
| Date | Buyer | Sale Price | Title Company |
|---|---|---|---|
| Frendian Michel | -- | None Available | |
| Frendian Michel | $360,000 | None Available | |
| Fisher Shane | $425,000 | Multiple |
Source: Public Records
Mortgage History
| Date | Status | Borrower | Loan Amount |
|---|---|---|---|
| Open | Frendian Michel | $350,874 | |
| Previous Owner | Fisher Shane | $340,000 | |
| Closed | Fisher Shane | $63,750 |
Source: Public Records
Tax History Compared to Growth
Tax History
| Year | Tax Paid | Tax Assessment Tax Assessment Total Assessment is a certain percentage of the fair market value that is determined by local assessors to be the total taxable value of land and additions on the property. | Land | Improvement |
|---|---|---|---|---|
| 2024 | $8,584 | $48,638 | $13,021 | $35,617 |
| 2023 | $8,346 | $44,000 | $10,501 | $33,499 |
| 2022 | $8,346 | $44,000 | $10,501 | $33,499 |
| 2021 | $8,178 | $43,999 | $10,500 | $33,499 |
| 2020 | $7,750 | $37,892 | $4,480 | $33,412 |
| 2019 | $7,604 | $41,277 | $4,480 | $36,797 |
| 2018 | $7,475 | $41,277 | $4,480 | $36,797 |
| 2017 | $7,083 | $36,276 | $3,920 | $32,356 |
| 2016 | $6,766 | $36,276 | $3,920 | $32,356 |
| 2015 | $6,167 | $36,276 | $3,920 | $32,356 |
| 2014 | $6,696 | $36,090 | $3,202 | $32,888 |
| 2013 | $6,564 | $36,090 | $3,202 | $32,888 |
Source: Public Records
Map
Nearby Homes
- 800 W Cornelia Ave Unit 307
- 3507 N Reta Ave Unit 3
- 747 W Brompton Ave Unit 3
- 718 W Cornelia Ave
- 902 W Newport Ave
- 903 W Cornelia Ave Unit 1N
- 862 W Roscoe St Unit 1
- 3541 N Wilton Ave Unit 2
- 902 W Roscoe St Unit 4
- 912 W Roscoe St Unit 1
- 744 W Buckingham Place Unit 4
- 625 W Addison St Unit 3
- 3519 N Sheffield Ave Unit 2N
- 611 W Patterson Ave Unit 317
- 3620 N Pine Grove Ave Unit 504
- 730 W Aldine Ave Unit 3W
- 632 W Buckingham Place Unit 2E
- 3638 N Pine Grove Ave Unit G2
- 544 W Brompton Ave Unit 1G
- 555 W Cornelia Ave Unit 1011
- 3503 N Reta Ave Unit 2N
- 3509 N Reta Ave Unit 3
- 3509 N Reta Ave Unit 4
- 3509 N Reta Ave Unit 3
- 3509 N Reta Ave Unit 2
- 3509 N Reta Ave Unit 1
- 3501 N Reta Ave
- 3501 N Reta Ave Unit 1N
- 3501 N Reta Ave Unit 3S
- 818 W Cornelia Ave
- 3511 N Reta Ave
- 816 W Cornelia Ave Unit A
- 816 W Cornelia Ave Unit 837-3S
- 816 W Cornelia Ave Unit A09C
- 816 W Cornelia Ave Unit 316
- 816 W Cornelia Ave Unit 102
- 816 W Cornelia Ave Unit 823-119
- 816 W Cornelia Ave
- 3513 N Reta Ave Unit 2
- 3513 N Reta Ave Unit 2