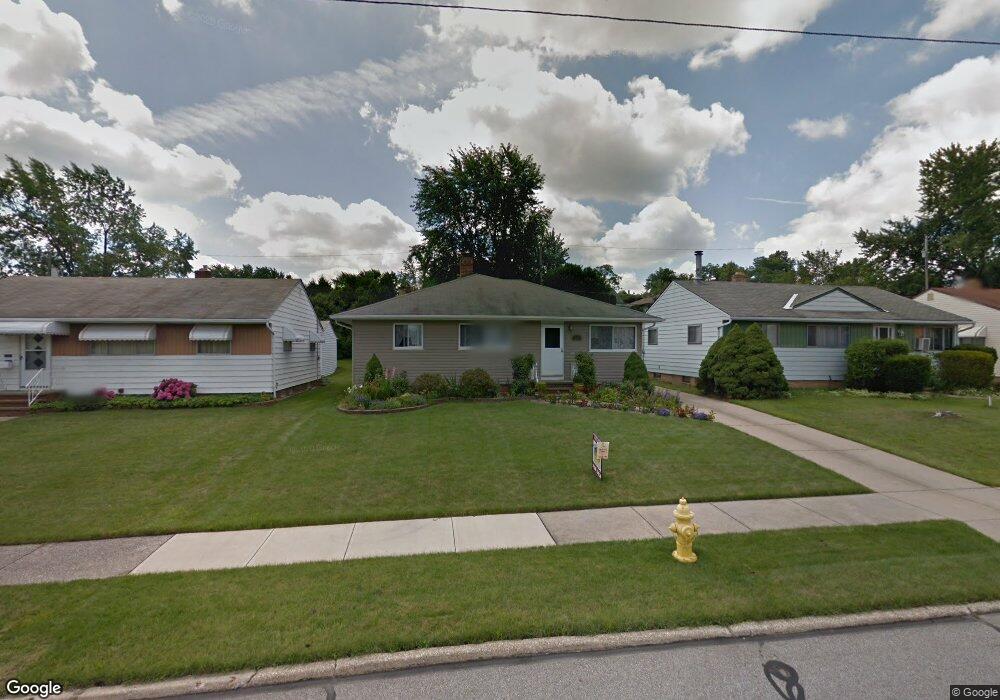
3507 Stanfield Dr Cleveland, OH 44134
Estimated Value: $207,000 - $251,000
3
Beds
2
Baths
1,640
Sq Ft
$144/Sq Ft
Est. Value
About This Home
This home is located at 3507 Stanfield Dr, Cleveland, OH 44134 and is currently estimated at $236,810, approximately $144 per square foot. 3507 Stanfield Dr is a home located in Cuyahoga County with nearby schools including Dentzler Elementary School, Normandy High School, and Hillside Middle School.
Ownership History
Date
Name
Owned For
Owner Type
Purchase Details
Closed on
Mar 14, 2014
Sold by
Zhakunets Volodymyr and Zhakunets Lidia
Bought by
Zhakunets Vitali
Current Estimated Value
Purchase Details
Closed on
Oct 27, 2010
Sold by
Zhakunets Halina and Zhakunets Leonid
Bought by
Zhakunets Volodymyr and Zhakunets Lidia
Purchase Details
Closed on
Oct 23, 1991
Sold by
Dubik Mary
Bought by
Zhakunets Halina
Purchase Details
Closed on
Sep 23, 1991
Sold by
Lus Mark P
Bought by
Dubik Mary
Purchase Details
Closed on
Jul 6, 1990
Sold by
Lus Mary
Bought by
Lus Mark P
Purchase Details
Closed on
Aug 31, 1988
Sold by
Lus Richard P and Lus Mary
Bought by
Lus Mary
Purchase Details
Closed on
Apr 2, 1985
Sold by
Lus Richard
Bought by
Lus Richard P and Lus Mary
Purchase Details
Closed on
Apr 12, 1976
Sold by
Fisher Donald L and Jean G
Bought by
Lus Richard
Purchase Details
Closed on
Jan 1, 1975
Bought by
Fisher Donald L and Fisher Jean G
Create a Home Valuation Report for This Property
The Home Valuation Report is an in-depth analysis detailing your home's value as well as a comparison with similar homes in the area
Home Values in the Area
Average Home Value in this Area
Purchase History
| Date | Buyer | Sale Price | Title Company |
|---|---|---|---|
| Zhakunets Vitali | $98,800 | Attorney | |
| Zhakunets Volodymyr | $104,500 | None Available | |
| Zhakunets Halina | $73,000 | -- | |
| Dubik Mary | -- | -- | |
| Lus Mark P | -- | -- | |
| Lus Mary | -- | -- | |
| Lus Richard P | -- | -- | |
| Lus Richard | $40,600 | -- | |
| Fisher Donald L | -- | -- |
Source: Public Records
Tax History Compared to Growth
Tax History
| Year | Tax Paid | Tax Assessment Tax Assessment Total Assessment is a certain percentage of the fair market value that is determined by local assessors to be the total taxable value of land and additions on the property. | Land | Improvement |
|---|---|---|---|---|
| 2024 | $3,968 | $63,910 | $12,110 | $51,800 |
| 2023 | $3,490 | $48,270 | $9,840 | $38,430 |
| 2022 | $3,460 | $48,270 | $9,840 | $38,430 |
| 2021 | $3,563 | $48,270 | $9,840 | $38,430 |
| 2020 | $3,378 | $40,570 | $8,260 | $32,310 |
| 2019 | $3,244 | $115,900 | $23,600 | $92,300 |
| 2018 | $3,005 | $40,570 | $8,260 | $32,310 |
| 2017 | $2,912 | $33,540 | $6,900 | $26,640 |
| 2016 | $2,895 | $33,540 | $6,900 | $26,640 |
| 2015 | $2,819 | $33,540 | $6,900 | $26,640 |
| 2014 | $2,819 | $34,590 | $7,110 | $27,480 |
Source: Public Records
Map
Nearby Homes
- 3711 Klusner Ave
- 3807 Klusner Ave
- 7030 Lyle Ave
- 3430 Park Dr
- 3262 Marda Dr
- 3610 Jeanne Dr
- 3011 Klusner Ave
- 3195 Marda Dr
- 3018 Center Dr
- 2838 Marda Dr
- 3200 Dentzler Rd
- 0 Orchard Park Dr
- 7180 Marko Ln
- 2410 Park Dr
- 4601 W Ridgewood Dr
- 2406 Park Dr
- 4001 W Ridgewood Dr
- 5208 Orchard Park Dr
- 6480 State Rd Unit F10
- 2644 Nottingham Dr
- 3513 Stanfield Dr
- 3503 Stanfield Dr
- 3517 Stanfield Dr
- 3506 Klusner Ave
- 3510 Klusner Ave
- 3435 Stanfield Dr
- 3502 Klusner Ave
- 3603 Stanfield Dr
- 3514 Klusner Ave
- 3518 Klusner Ave
- 3506 Stanfield Dr
- 3431 Stanfield Dr
- 3512 Stanfield Dr
- 3502 Stanfield Dr
- 3602 Klusner Ave
- 3607 Stanfield Dr
- 3516 Stanfield Dr
- 3427 Stanfield Dr
- 3606 Klusner Ave
- 3430 Klusner Ave