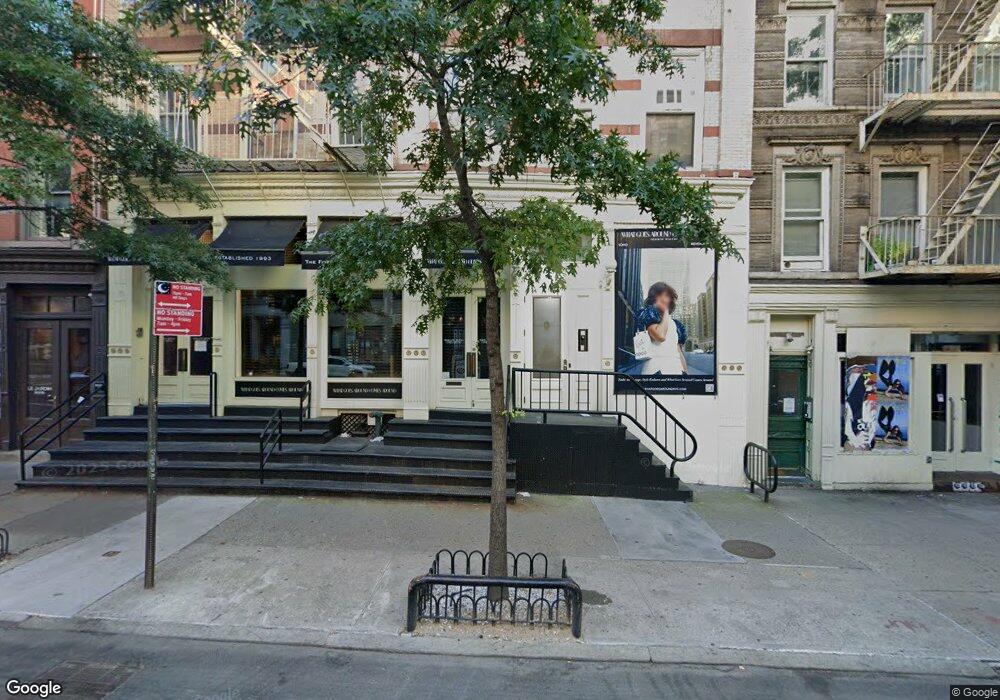
351 W Broadway Unit 5 New York, NY 10013
Bay Ridge NeighborhoodEstimated Value: $3,167,000 - $5,502,000
--
Bed
--
Bath
2,536
Sq Ft
$1,717/Sq Ft
Est. Value
About This Home
This home is located at 351 W Broadway Unit 5, New York, NY 10013 and is currently estimated at $4,353,733, approximately $1,716 per square foot. 351 W Broadway Unit 5 is a home located in New York County with nearby schools including P.S. 102 The Bayview School, Junior High School 259 William McKinley, and Fort Hamilton High School.
Ownership History
Date
Name
Owned For
Owner Type
Purchase Details
Closed on
Jan 15, 2025
Sold by
Schwimmer Anne
Bought by
Gesky Thomas
Current Estimated Value
Purchase Details
Closed on
Dec 8, 2020
Sold by
Schwimmer Jay
Bought by
Schwimmer Anne
Purchase Details
Closed on
Sep 21, 1999
Sold by
Schwimmer Jay
Bought by
Schwimmer Anne
Home Financials for this Owner
Home Financials are based on the most recent Mortgage that was taken out on this home.
Original Mortgage
$189,499
Interest Rate
7.05%
Purchase Details
Closed on
Aug 13, 1998
Sold by
351 Realty Llc
Bought by
Schwimmer Jay and Schwimmer Anne
Home Financials for this Owner
Home Financials are based on the most recent Mortgage that was taken out on this home.
Original Mortgage
$500,000
Interest Rate
9.5%
Create a Home Valuation Report for This Property
The Home Valuation Report is an in-depth analysis detailing your home's value as well as a comparison with similar homes in the area
Home Values in the Area
Average Home Value in this Area
Purchase History
| Date | Buyer | Sale Price | Title Company |
|---|---|---|---|
| Gesky Thomas | $4,150,000 | -- | |
| Schwimmer Anne | -- | -- | |
| Schwimmer Anne | -- | -- | |
| Schwimmer Anne | -- | -- | |
| Schwimmer Jay | -- | -- | |
| Schwimmer Jay | -- | -- |
Source: Public Records
Mortgage History
| Date | Status | Borrower | Loan Amount |
|---|---|---|---|
| Previous Owner | Schwimmer Anne | $189,499 | |
| Previous Owner | Schwimmer Jay | $500,000 |
Source: Public Records
Tax History Compared to Growth
Tax History
| Year | Tax Paid | Tax Assessment Tax Assessment Total Assessment is a certain percentage of the fair market value that is determined by local assessors to be the total taxable value of land and additions on the property. | Land | Improvement |
|---|---|---|---|---|
| 2025 | $33,578 | $277,177 | $13,496 | $263,681 |
| 2024 | $33,578 | $268,581 | $39,756 | $258,119 |
| 2023 | $25,168 | $248,687 | $11,625 | $237,062 |
| 2022 | $23,243 | $921,371 | $39,756 | $881,615 |
| 2021 | $26,155 | $1,084,012 | $39,756 | $1,044,256 |
| 2020 | $21,940 | $1,052,442 | $39,756 | $1,012,686 |
| 2019 | $21,497 | $877,078 | $39,756 | $837,322 |
| 2018 | $24,331 | $191,298 | $10,405 | $180,893 |
| 2017 | $22,529 | $177,130 | $10,897 | $166,233 |
| 2016 | $21,144 | $164,010 | $10,225 | $153,785 |
| 2015 | $11,145 | $164,010 | $8,179 | $155,831 |
| 2014 | $11,145 | $158,925 | $9,510 | $149,415 |
Source: Public Records
Map
Nearby Homes
- 6916 4th Ave
- 351 W Broadway Unit 4
- 351 W Broadway Unit 2
- 359 Ovington Ave Unit F5
- 418 Bay Ridge Pkwy
- 413 68th St
- 333 Bay Ridge Ave
- 370 Senator St
- 324 Bay Ridge Ave
- 439 68th St Unit 3F
- 441 68th St
- 312 Bay Ridge Ave
- 338 Senator St
- 7110 Bennett Ct
- 6819 3rd Ave
- 7001 3rd Ave
- 445 Senator St
- 474 Senator St
- 474 Bay Ridge Ave
- 6812 3rd Ave
- 351 W Broadway Unit S
- 351 W Broadway Unit N
- 351 W Broadway Unit PENTHOUSE
- 351 W Broadway
- 351 Bay Ridge Ave
- 349 Bay Ridge Ave
- 349 W Broadway
- 349 W Broadway
- 349 W Broadway Unit 7
- 349 W Broadway Unit 19
- 349 W Broadway Unit 14
- 349 W Broadway Unit 22
- 349 W Broadway Unit 1
- 349 W Broadway Unit 11
- 349 W Broadway Unit GROUNDF
- 349 W Broadway Unit 12
- 349 W Broadway Unit 20
- 349 W Broadway Unit 3
- 349 W Broadway Unit 23
- 349 W Broadway Unit 4