Estimated Value: $830,059 - $1,167,000
2
Beds
1
Bath
755
Sq Ft
$1,258/Sq Ft
Est. Value
About This Home
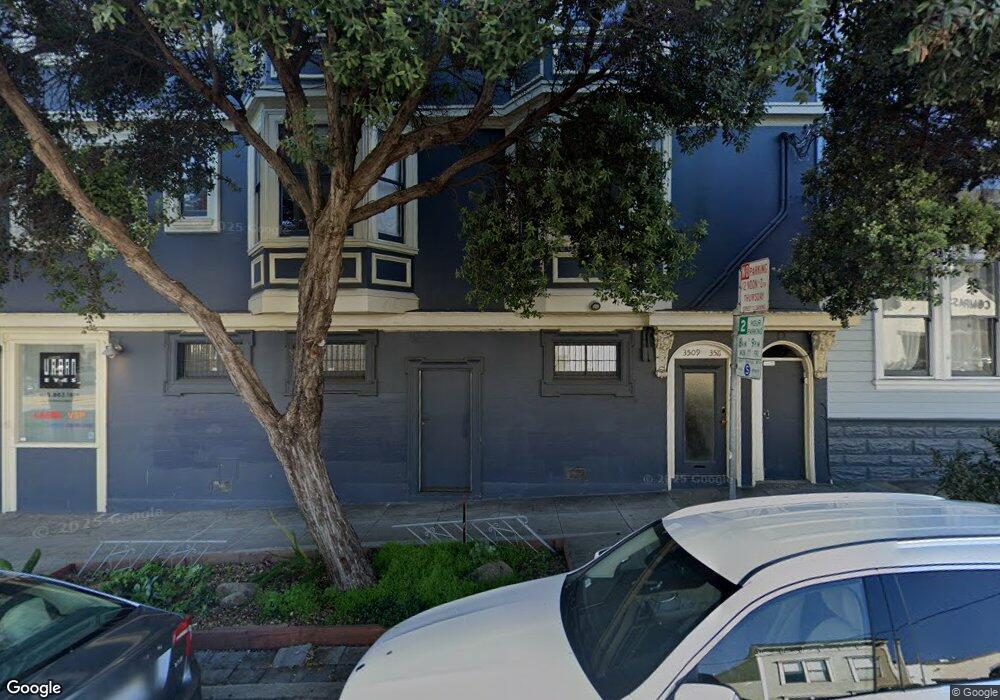
This home is located at 3511 16th St, San Francisco, CA 94114 and is currently estimated at $950,015, approximately $1,258 per square foot. 3511 16th St is a home located in San Francisco County with nearby schools including Sanchez Elementary, Everett Middle School, and Creative Arts Charter School.
Ownership History
Date
Name
Owned For
Owner Type
Purchase Details
Closed on
Mar 19, 2013
Sold by
300 Sanchez Street Llc and Ramirez Flora
Current Estimated Value
Purchase Details
Closed on
Jun 13, 2011
Sold by
Hardy Kevin C
Home Financials for this Owner
Home Financials are based on the most recent Mortgage that was taken out on this home.
Original Mortgage
$20,950
Outstanding Balance
$14,447
Interest Rate
4.56%
Mortgage Type
Unknown
Estimated Equity
$935,568
Purchase Details
Closed on
Oct 4, 2006
Sold by
Campbell Yvonne
Bought by
Hardy Kevin C
Purchase Details
Closed on
Aug 12, 2002
Sold by
300 Sanches Street Llc
Bought by
Quivey Shane and Wetzel Wendy Kathryn
Home Financials for this Owner
Home Financials are based on the most recent Mortgage that was taken out on this home.
Original Mortgage
$350,000
Interest Rate
20.59%
Mortgage Type
Seller Take Back
Create a Home Valuation Report for This Property
The Home Valuation Report is an in-depth analysis detailing your home's value as well as a comparison with similar homes in the area
Home Values in the Area
Average Home Value in this Area
Purchase History
| Date | Buyer | Sale Price | Title Company |
|---|---|---|---|
| -- | -- | Chicago Title Company | |
| -- | $409,000 | Chicago Title Company | |
| Hardy Kevin C | $549,000 | Alliance Title Company | |
| Quivey Shane | $350,000 | Fidelity National Title Co |
Source: Public Records
Mortgage History
| Date | Status | Borrower | Loan Amount |
|---|---|---|---|
| Open | -- | $20,950 | |
| Open | -- | $140,000 | |
| Previous Owner | Quivey Shane | $350,000 |
Source: Public Records
Tax History Compared to Growth
Tax History
| Year | Tax Paid | Tax Assessment Tax Assessment Total Assessment is a certain percentage of the fair market value that is determined by local assessors to be the total taxable value of land and additions on the property. | Land | Improvement |
|---|---|---|---|---|
| 2025 | $6,725 | $523,986 | $261,993 | $261,993 |
| 2024 | $6,725 | $513,712 | $256,856 | $256,856 |
| 2023 | $6,615 | $503,640 | $251,820 | $251,820 |
| 2022 | $6,475 | $493,766 | $246,883 | $246,883 |
| 2021 | $6,355 | $484,086 | $242,043 | $242,043 |
| 2020 | $6,398 | $479,124 | $239,562 | $239,562 |
| 2019 | $6,181 | $469,730 | $234,865 | $234,865 |
| 2018 | $5,973 | $460,520 | $230,260 | $230,260 |
| 2017 | $5,603 | $451,492 | $225,746 | $225,746 |
| 2016 | $5,489 | $442,640 | $221,320 | $221,320 |
| 2015 | $5,419 | $435,992 | $217,996 | $217,996 |
| 2014 | $5,276 | $427,452 | $213,726 | $213,726 |
Source: Public Records
Map
Nearby Homes
- 2256 Market St
- 2260 Market St
- 3749 17th St Unit B
- 3747 17th St
- 2317-2335 Market St
- 370 Church St Unit G
- 2152 15th St
- 12 Beaver St
- 3386 16th St
- 516 Church St
- 367 Church St Unit 5
- 22 Beaver St
- 4038 18th St
- 350 Dolores St
- 262 Castro St
- 380 Dolores St Unit 10
- 380 Dolores St Unit 9
- 260 Castro St
- 146 Henry St
- 592 Sanchez St
- 302 Sanchez St
- 3509 16th St
- 304 Sanchez St
- 300 Sanchez St
- 306 Sanchez St
- 308 Sanchez St
- 310 Sanchez St Unit 312
- 316 Sanchez St
- 314 Sanchez St
- 3515 16th St Unit 3519
- 3521 16th St Unit 3523
- 3527 16th St Unit 3527
- 3525 16th St
- 320 Sanchez St Unit 322
- 282-290 Sanchez St
- 326 Sanchez St
- 324 Sanchez St Unit 324
- 15 Prosper St
- 317 Sanchez St
- 21 Prosper St