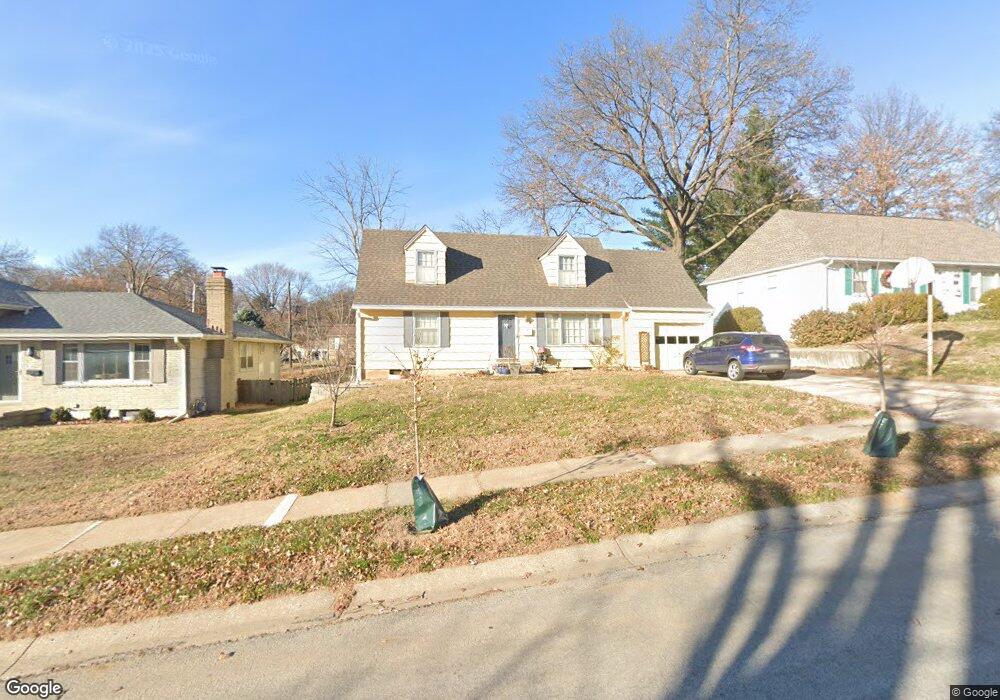
3514 NE 48th Terrace Kansas City, MO 64119
Sherwood Estates NeighborhoodEstimated Value: $267,001 - $316,000
3
Beds
2
Baths
1,642
Sq Ft
$177/Sq Ft
Est. Value
About This Home
This home is located at 3514 NE 48th Terrace, Kansas City, MO 64119 and is currently estimated at $290,500, approximately $176 per square foot. 3514 NE 48th Terrace is a home located in Clay County with nearby schools including Lakewood Elementary School, Maple Park Middle School, and Winnetonka High School.
Ownership History
Date
Name
Owned For
Owner Type
Purchase Details
Closed on
Dec 8, 2006
Sold by
Armentrout Yvette
Bought by
Williams Rebecca L
Current Estimated Value
Home Financials for this Owner
Home Financials are based on the most recent Mortgage that was taken out on this home.
Original Mortgage
$147,385
Outstanding Balance
$88,118
Interest Rate
6.31%
Mortgage Type
Unknown
Estimated Equity
$202,382
Purchase Details
Closed on
Jun 23, 2005
Sold by
Armentrout Bruce R and Armentrout Tami E
Bought by
Armentrout Yvette
Home Financials for this Owner
Home Financials are based on the most recent Mortgage that was taken out on this home.
Original Mortgage
$144,728
Interest Rate
5.63%
Mortgage Type
FHA
Purchase Details
Closed on
Aug 25, 2004
Sold by
Messina Steve and Messina Regina
Bought by
Armentrout Bruce R and Armentrout Tami E
Home Financials for this Owner
Home Financials are based on the most recent Mortgage that was taken out on this home.
Original Mortgage
$134,425
Interest Rate
7.37%
Mortgage Type
Purchase Money Mortgage
Purchase Details
Closed on
May 20, 2002
Sold by
Dickey Lucas Samuel and Dickey Jennifer Jo
Bought by
Dickey Lucas Samuel and Dickey Jennifer Jo
Create a Home Valuation Report for This Property
The Home Valuation Report is an in-depth analysis detailing your home's value as well as a comparison with similar homes in the area
Home Values in the Area
Average Home Value in this Area
Purchase History
| Date | Buyer | Sale Price | Title Company |
|---|---|---|---|
| Williams Rebecca L | -- | Metropolitan Title & Escrow | |
| Armentrout Yvette | -- | Chicago | |
| Armentrout Bruce R | -- | Absolute Title Co Inc | |
| Dickey Lucas Samuel | -- | -- |
Source: Public Records
Mortgage History
| Date | Status | Borrower | Loan Amount |
|---|---|---|---|
| Open | Williams Rebecca L | $147,385 | |
| Previous Owner | Armentrout Yvette | $144,728 | |
| Previous Owner | Armentrout Bruce R | $134,425 |
Source: Public Records
Tax History Compared to Growth
Tax History
| Year | Tax Paid | Tax Assessment Tax Assessment Total Assessment is a certain percentage of the fair market value that is determined by local assessors to be the total taxable value of land and additions on the property. | Land | Improvement |
|---|---|---|---|---|
| 2025 | $2,347 | $31,980 | -- | -- |
| 2024 | $2,347 | $29,130 | -- | -- |
| 2023 | $2,326 | $29,130 | $0 | $0 |
| 2022 | $2,194 | $26,260 | $0 | $0 |
| 2021 | $2,196 | $26,258 | $4,560 | $21,698 |
| 2020 | $2,285 | $25,270 | $4,560 | $20,710 |
| 2019 | $2,243 | $25,270 | $4,560 | $20,710 |
| 2018 | $2,151 | $23,160 | $0 | $0 |
| 2017 | $2,019 | $23,160 | $3,420 | $19,740 |
| 2016 | $2,019 | $22,140 | $3,420 | $18,720 |
| 2015 | $2,018 | $22,140 | $3,420 | $18,720 |
| 2014 | $2,094 | $22,630 | $3,040 | $19,590 |
Source: Public Records
Map
Nearby Homes
- 3237 NE 47th Terrace
- 4948 N College Ave
- 4452 N Walrond Ave
- 3715 NE 52nd Terrace
- 5217 N Walrond Ave
- 4456 N Bellefontaine Ave
- 3711 NE 53rd St
- 5221 N Bellefontaine Ave
- 4845 NE Antioch Rd
- 5310 N Indiana Ave
- 4313 NE 46th St
- 4437 N Jackson Ave
- 4421 NE Winn Rd
- 5014 N Cypress Ave
- 4603 NE 47th Terrace
- 4603 NE 47 Terrace
- 4412 N Jackson Ave
- 4604 NE 47th St
- 4614 NE Antioch Rd
- 3416 NE 43rd St
- 3508 NE 48th Terrace
- 3522 NE 48th Terrace
- 3509 NE 49th St
- 3515 NE 49th St
- 3528 NE 48th Terrace
- 4829 NE Sherwood Dr
- 4823 NE Sherwood Dr
- 3515 NE 48th Terrace
- 3523 NE 48th Terrace
- 3523 NE 49th St
- 3509 NE 48th Terrace
- 4835 NE Sherwood Dr
- 3600 NE 48th Terrace
- 3529 NE 48th Terrace
- 4819 NE Sherwood Dr
- 3529 NE 49th St
- 3601 NE 48th Terrace
- 3522 NE 48th St
- 3606 NE 48th Terrace
- 4813 NE Sherwood Dr