3515 W 3800 S Rexburg, ID 83440
Estimated Value: $584,909 - $846,000
4
Beds
3
Baths
3,476
Sq Ft
$206/Sq Ft
Est. Value
About This Home
This home is located at 3515 W 3800 S, Rexburg, ID 83440 and is currently estimated at $714,727, approximately $205 per square foot. 3515 W 3800 S is a home located in Madison County with nearby schools including Burton Elementary School, Kennedy Elementary School, and Madison Junior High School.
Ownership History
Date
Name
Owned For
Owner Type
Purchase Details
Closed on
Jul 13, 2022
Sold by
Sewell Richard W and Sewell Candace
Bought by
Sewell Richard W and Sewell Candace A
Current Estimated Value
Home Financials for this Owner
Home Financials are based on the most recent Mortgage that was taken out on this home.
Original Mortgage
$428,041
Outstanding Balance
$407,232
Interest Rate
5.09%
Mortgage Type
FHA
Estimated Equity
$307,495
Purchase Details
Closed on
Jun 10, 2021
Sold by
Valora Parley and Valora Darla
Bought by
Sewell Richard W and Sewell Candace
Home Financials for this Owner
Home Financials are based on the most recent Mortgage that was taken out on this home.
Original Mortgage
$12,949
Interest Rate
2.96%
Mortgage Type
New Conventional
Purchase Details
Closed on
Dec 22, 2014
Sold by
Tew Daniel B
Bought by
Valora Parley and Valora Darla
Create a Home Valuation Report for This Property
The Home Valuation Report is an in-depth analysis detailing your home's value as well as a comparison with similar homes in the area
Home Values in the Area
Average Home Value in this Area
Purchase History
| Date | Buyer | Sale Price | Title Company |
|---|---|---|---|
| Sewell Richard W | -- | Alliance Title | |
| Sewell Richard W | -- | Alliance Title & Escrow | |
| Valora Parley | -- | Alliance Title Rexburg |
Source: Public Records
Mortgage History
| Date | Status | Borrower | Loan Amount |
|---|---|---|---|
| Open | Sewell Richard W | $428,041 | |
| Previous Owner | Sewell Richard W | $12,949 | |
| Previous Owner | Sewell Richard W | $362,598 |
Source: Public Records
Tax History Compared to Growth
Tax History
| Year | Tax Paid | Tax Assessment Tax Assessment Total Assessment is a certain percentage of the fair market value that is determined by local assessors to be the total taxable value of land and additions on the property. | Land | Improvement |
|---|---|---|---|---|
| 2025 | $2,421 | $472,932 | $85,000 | $387,932 |
| 2024 | $2,421 | $472,932 | $85,000 | $387,932 |
| 2023 | $2,421 | $446,091 | $441,837 | $4,254 |
| 2022 | $3,121 | $434,249 | $70,000 | $364,249 |
| 2021 | $2,516 | $334,181 | $40,000 | $294,181 |
| 2020 | $3,510 | $286,933 | $40,000 | $246,933 |
| 2019 | $3,591 | $261,699 | $40,000 | $221,699 |
| 2018 | $3,307 | $239,735 | $40,000 | $199,735 |
| 2017 | $3,226 | $228,753 | $40,000 | $188,753 |
| 2016 | $3,154 | $228,753 | $40,000 | $188,753 |
| 2015 | $2,976 | $206,789 | $0 | $0 |
| 2013 | $2,976 | $224,638 | $0 | $0 |
Source: Public Records
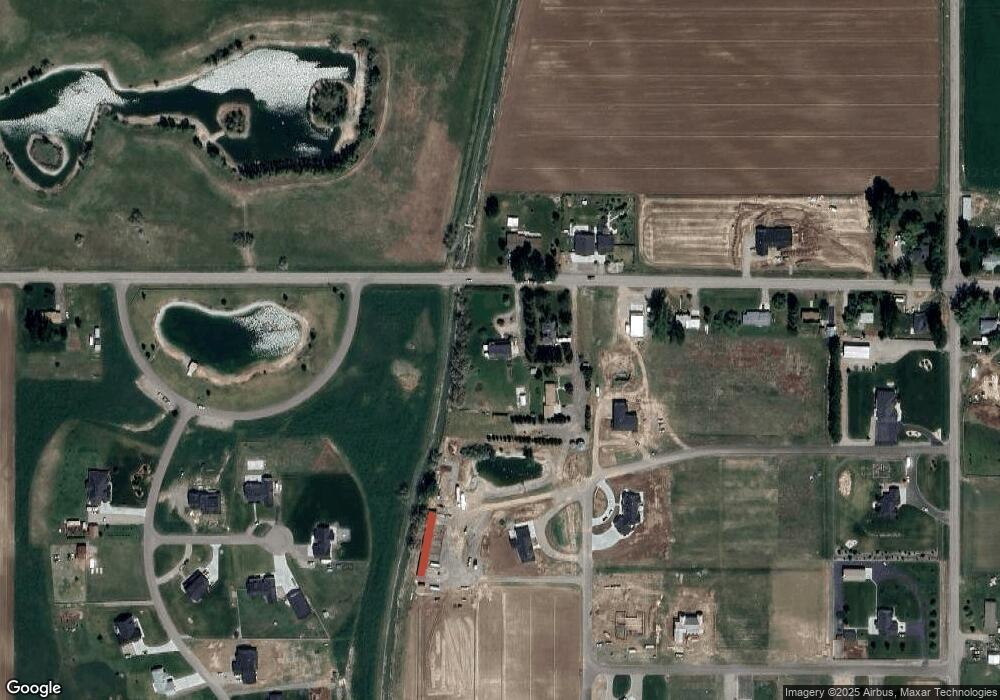
Map
Nearby Homes
- TBD Sequoia Ct
- 3800 Sequoia Ct
- Lot 5 W 3800 S
- Ashland Plan at Harvest Estates
- Westbrook Plan at Harvest Estates
- Berrington Plan at Harvest Estates
- Denford Plan at Harvest Estates
- Milton Plan at Harvest Estates
- Foxhill Plan at Harvest Estates
- Edgeworth Plan at Harvest Estates
- Hadleigh Plan at Harvest Estates
- Brantwood Plan at Harvest Estates
- Norfolk Plan at Harvest Estates
- Vanbrough Plan at Harvest Estates
- Xavier Plan at Harvest Estates
- Cambria Plan at Harvest Estates
- Stanton Plan at Harvest Estates
- Canyon Plan at Harvest Estates
- Kensington Plan at Harvest Estates
- Hyland Plan at Harvest Estates
- 3503 W 3800 S
- 32 AC W 3800 S
- 10.5 AC W 3800 S
- 10.1 AC W 3800 S
- 9.9 AC W 3800 S
- 3501 W 3800 S
- TBD L5B1 3800 S
- 3531 W 3800 S
- 3477 W 3800 S
- 3472 Francis
- TBD L4B1 Francis St
- 3530 W 3800 S
- 3465 Francis
- 3750 Redwood Ct
- 3740 Redwood Ct
- TBD L3B1 Francis St
- 3510 Francis
- 3389 W 3800 S
- 3751 Redwood Ct
- 3670 Redwood Ct