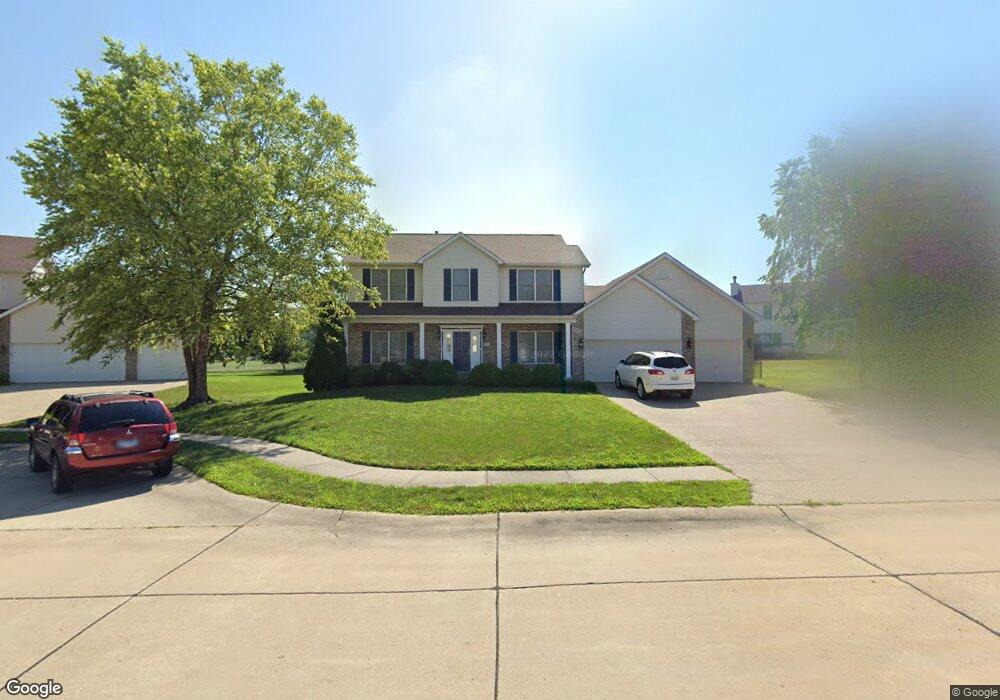
3526 Adler Ct Belleville, IL 62221
Estimated Value: $378,000 - $406,000
4
Beds
4
Baths
2,368
Sq Ft
$166/Sq Ft
Est. Value
About This Home
This home is located at 3526 Adler Ct, Belleville, IL 62221 and is currently estimated at $392,958, approximately $165 per square foot. 3526 Adler Ct is a home located in St. Clair County with nearby schools including Shiloh Elementary School, Shiloh Middle School, and O'Fallon Township High School.
Ownership History
Date
Name
Owned For
Owner Type
Purchase Details
Closed on
Mar 6, 2013
Sold by
Fannie Mae
Bought by
Grubb Joe and Grubb Cynthia D
Current Estimated Value
Home Financials for this Owner
Home Financials are based on the most recent Mortgage that was taken out on this home.
Original Mortgage
$222,687
Outstanding Balance
$155,063
Interest Rate
3.25%
Mortgage Type
VA
Estimated Equity
$237,895
Purchase Details
Closed on
Oct 30, 2012
Sold by
Koester Wade M
Bought by
Federal National Mortgage Association
Purchase Details
Closed on
Oct 28, 2004
Sold by
Whittaker Builders Inc
Bought by
Koester Wade M and Koester Deana L
Home Financials for this Owner
Home Financials are based on the most recent Mortgage that was taken out on this home.
Original Mortgage
$215,360
Interest Rate
5.85%
Mortgage Type
Purchase Money Mortgage
Create a Home Valuation Report for This Property
The Home Valuation Report is an in-depth analysis detailing your home's value as well as a comparison with similar homes in the area
Home Values in the Area
Average Home Value in this Area
Purchase History
| Date | Buyer | Sale Price | Title Company |
|---|---|---|---|
| Grubb Joe | $218,000 | Wheatland Title | |
| Federal National Mortgage Association | -- | None Available | |
| Koester Wade M | $269,500 | Benchmark Title Company |
Source: Public Records
Mortgage History
| Date | Status | Borrower | Loan Amount |
|---|---|---|---|
| Open | Grubb Joe | $222,687 | |
| Previous Owner | Koester Wade M | $215,360 | |
| Closed | Koester Wade M | $26,910 |
Source: Public Records
Tax History Compared to Growth
Tax History
| Year | Tax Paid | Tax Assessment Tax Assessment Total Assessment is a certain percentage of the fair market value that is determined by local assessors to be the total taxable value of land and additions on the property. | Land | Improvement |
|---|---|---|---|---|
| 2024 | -- | $101,751 | $19,489 | $82,262 |
| 2023 | -- | $93,650 | $18,916 | $74,734 |
| 2022 | $0 | $87,230 | $17,619 | $69,611 |
| 2021 | $0 | $82,030 | $16,569 | $65,461 |
| 2020 | $0 | $77,419 | $15,637 | $61,782 |
| 2019 | $0 | $75,716 | $16,243 | $59,473 |
| 2018 | $0 | $73,553 | $15,779 | $57,774 |
| 2017 | $0 | $70,099 | $15,038 | $55,061 |
| 2016 | $0 | $68,765 | $14,752 | $54,013 |
| 2014 | $5,019 | $68,543 | $15,084 | $53,459 |
| 2013 | $6,255 | $69,467 | $15,287 | $54,180 |
Source: Public Records
Map
Nearby Homes
- 3536 Harbor Way
- xxxx Chippewa Dr
- 3567 Sky Hawk Dr
- 3533 Capri Ln
- Brady Plan at Indian Springs - Indian Spring
- Winchester B Plan at Indian Springs - Indian Spring
- Alexandria Plan at Indian Springs - Indian Spring
- Hannah Plan at Indian Springs - Indian Spring
- Culpepper Plan at Indian Springs - Indian Spring
- Bristol Villa Plan at Indian Springs - Indian Spring
- Bristol Plan at Indian Springs - Indian Spring
- Covington 2 Car Plan at Indian Springs - Indian Spring
- Winchester A Plan at Indian Springs - Indian Spring
- Sunrise Plan at Indian Springs - Indian Spring
- Bella Plan at Indian Springs - Indian Spring
- Covington Plan at Indian Springs - Indian Spring
- Titan Plan at Indian Springs - Indian Spring
- Herndon Plan at Indian Springs - Indian Spring
- Scarlett Plan at Indian Springs - Indian Spring
- 101 Montrose Ct
- 104 Eagles Landing Dr
- 3520 Adler Ct
- 108 Eagles Landing Dr
- 3534 Adler Ct
- 112 Eagles Landing Dr
- 3521 Adler Ct
- 3516 Adler Ct
- 3525 Adler Ct
- 100 Eagles Landing Dr
- 3517 Adler Ct
- 3529 Adler Ct
- 116 Eagles Landing Dr
- 3536 Adler Ct
- 3531 Adler Ct
- 3537 Harbor Way
- 3533 Harbor Way
- 109 Eagles Landing Dr
- 105 Eagles Landing Dr
- 3541 Harbor Way
- 113 Eagles Landing Dr