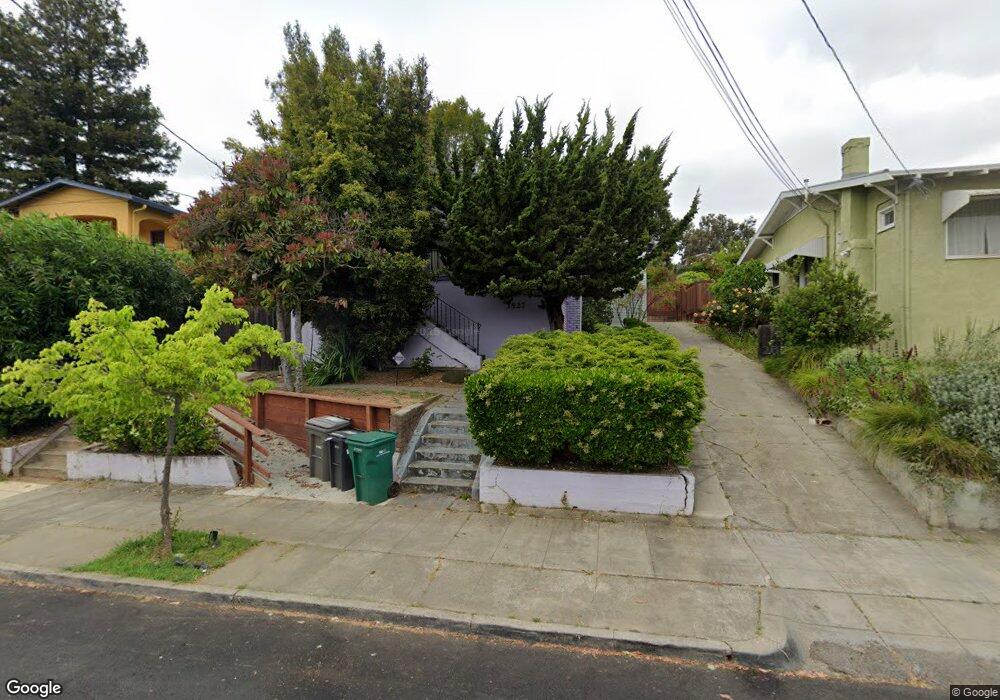
3527 Boston Ave Oakland, CA 94602
Dimond District NeighborhoodEstimated Value: $707,000 - $839,000
2
Beds
1
Bath
1,120
Sq Ft
$691/Sq Ft
Est. Value
About This Home
This home is located at 3527 Boston Ave, Oakland, CA 94602 and is currently estimated at $773,616, approximately $690 per square foot. 3527 Boston Ave is a home located in Alameda County with nearby schools including Sequoia Elementary School, Bret Harte Middle School, and Skyline High School.
Ownership History
Date
Name
Owned For
Owner Type
Purchase Details
Closed on
Dec 26, 1996
Sold by
Christensen James C and The Revocable Trust Of Archie
Bought by
Holston Susan L
Current Estimated Value
Home Financials for this Owner
Home Financials are based on the most recent Mortgage that was taken out on this home.
Original Mortgage
$143,303
Outstanding Balance
$15,336
Interest Rate
7.59%
Mortgage Type
FHA
Estimated Equity
$758,280
Purchase Details
Closed on
Mar 8, 1994
Sold by
Hawkins Archie D
Bought by
Hawkins Archie D
Home Financials for this Owner
Home Financials are based on the most recent Mortgage that was taken out on this home.
Original Mortgage
$100,000
Interest Rate
7.1%
Purchase Details
Closed on
Feb 4, 1994
Sold by
Hawkins Archie D
Bought by
Hawkins Archie D
Home Financials for this Owner
Home Financials are based on the most recent Mortgage that was taken out on this home.
Original Mortgage
$100,000
Interest Rate
7.1%
Create a Home Valuation Report for This Property
The Home Valuation Report is an in-depth analysis detailing your home's value as well as a comparison with similar homes in the area
Home Values in the Area
Average Home Value in this Area
Purchase History
| Date | Buyer | Sale Price | Title Company |
|---|---|---|---|
| Holston Susan L | $146,500 | Old Republic Title Company | |
| Hawkins Archie D | -- | -- | |
| Hawkins Archie D | -- | First American Title Guarant |
Source: Public Records
Mortgage History
| Date | Status | Borrower | Loan Amount |
|---|---|---|---|
| Open | Holston Susan L | $143,303 | |
| Previous Owner | Hawkins Archie D | $100,000 |
Source: Public Records
Tax History Compared to Growth
Tax History
| Year | Tax Paid | Tax Assessment Tax Assessment Total Assessment is a certain percentage of the fair market value that is determined by local assessors to be the total taxable value of land and additions on the property. | Land | Improvement |
|---|---|---|---|---|
| 2025 | $4,791 | $231,587 | $71,657 | $166,930 |
| 2024 | $4,791 | $226,910 | $70,253 | $163,657 |
| 2023 | $4,925 | $229,324 | $68,875 | $160,449 |
| 2022 | $4,737 | $217,828 | $67,525 | $157,303 |
| 2021 | $4,416 | $213,420 | $66,201 | $154,219 |
| 2020 | $4,364 | $218,161 | $65,523 | $152,638 |
| 2019 | $4,128 | $213,884 | $64,238 | $149,646 |
| 2018 | $4,040 | $209,692 | $62,979 | $146,713 |
| 2017 | $3,858 | $205,581 | $61,744 | $143,837 |
| 2016 | $3,661 | $201,551 | $60,534 | $141,017 |
| 2015 | $3,635 | $198,524 | $59,625 | $138,899 |
| 2014 | $3,543 | $194,636 | $58,457 | $136,179 |
Source: Public Records
Map
Nearby Homes
- 3477 Boston Ave Unit 4
- 2240 Macarthur Blvd
- 3220 Champion St
- 2715 Macarthur Blvd
- 3541 Dimond Ave
- 3826 Lincoln Ave
- 3316 Coolidge Ave
- 2550 Pleasant St
- 2106 Woodbine Ave
- 3847 Fruitvale Ave
- 3887 Forest Hill Ave
- 2726 Madeline St
- 3853 Rhoda Ave
- 2510 Delmer St
- 3044 Capp St
- 2628 School St
- 3120 School St
- 3137 Pleitner Ave
- 2958 Georgia St
- 3521 Boston Ave
- 3533 Boston Ave
- 3515 Boston Ave
- 3539 Boston Ave
- 3545 Boston Ave
- 3550 Lincoln Ave
- 3512 Boston Ave
- 3554 Lincoln Ave
- 3524 Boston Ave
- 3551 Boston Ave
- 3528 Boston Ave
- 3532 Boston Ave
- 3558 Lincoln Ave
- 3538 Boston Ave
- 3557 Boston Ave
- 2400 Macarthur Blvd
- 3544 Boston Ave
- 2518 Macarthur Blvd
- 3562 Lincoln Ave
- 3550 Boston Ave