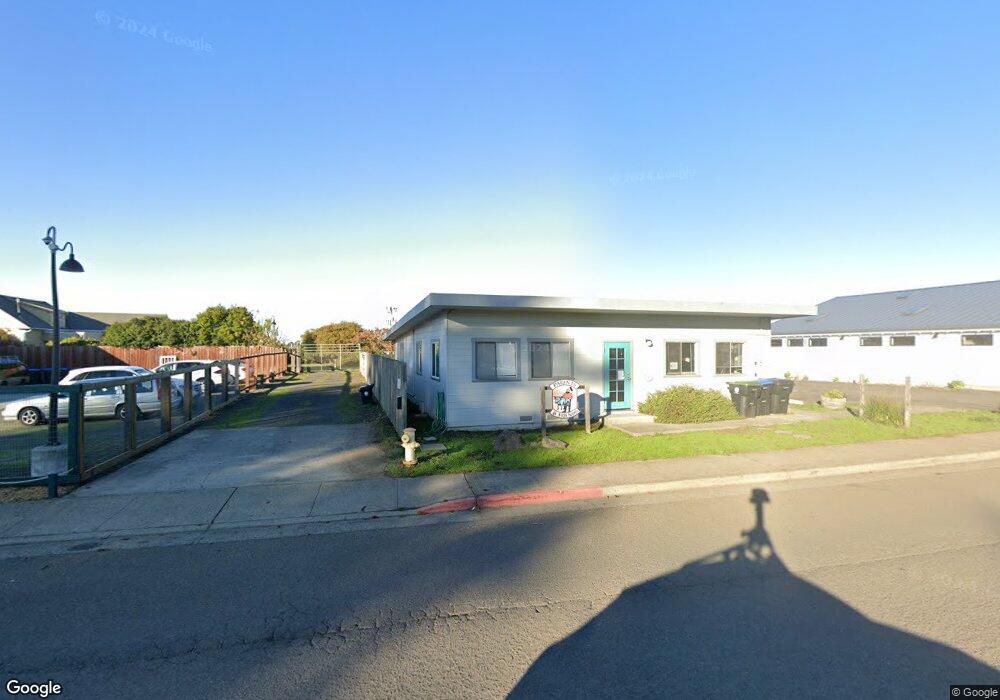
353 Cypress St Fort Bragg, CA 95437
Estimated Value: $499,000 - $670,000
--
Bed
--
Bath
--
Sq Ft
0.64
Acres
About This Home
This home is located at 353 Cypress St, Fort Bragg, CA 95437 and is currently estimated at $585,559. 353 Cypress St is a home located in Mendocino County with nearby schools including Fort Bragg High School.
Ownership History
Date
Name
Owned For
Owner Type
Purchase Details
Closed on
Aug 6, 2010
Sold by
Nguyen Thoi and Jonish David Paul
Bought by
Jonish David P and Nguyen Thoi Thi
Current Estimated Value
Purchase Details
Closed on
May 17, 2010
Sold by
Jorgensen Schuyler Lisa and Jorgensen Douglas Diana
Bought by
Nguyen Thoi and Jonish David Paul
Home Financials for this Owner
Home Financials are based on the most recent Mortgage that was taken out on this home.
Original Mortgage
$198,000
Outstanding Balance
$132,581
Interest Rate
5.03%
Mortgage Type
New Conventional
Estimated Equity
$452,978
Purchase Details
Closed on
Sep 29, 2007
Sold by
Jorgensen Paul and Gumpert Jorgensen Rosamond
Bought by
Jorgensen Schuyler Lisa and Jorgensen Douglas Diana
Purchase Details
Closed on
Jun 2, 2003
Sold by
Velasquez Raul
Bought by
Jorgensen Paul and Gumpert Jorgensen Rosamond
Purchase Details
Closed on
Apr 11, 2003
Sold by
Bjorklund Sheryl Lee and Velasquez Sheryl Lee
Bought by
Velasquez Raul
Create a Home Valuation Report for This Property
The Home Valuation Report is an in-depth analysis detailing your home's value as well as a comparison with similar homes in the area
Home Values in the Area
Average Home Value in this Area
Purchase History
| Date | Buyer | Sale Price | Title Company |
|---|---|---|---|
| Jonish David P | -- | Redwood Empire Title | |
| Nguyen Thoi | $358,000 | Redwood Empire Title Company | |
| Jorgensen Schuyler Lisa | -- | None Available | |
| Jorgensen Paul | $305,000 | Redwood Empire Title | |
| Velasquez Raul | -- | Redwood Empire Title |
Source: Public Records
Mortgage History
| Date | Status | Borrower | Loan Amount |
|---|---|---|---|
| Open | Nguyen Thoi | $198,000 |
Source: Public Records
Tax History Compared to Growth
Tax History
| Year | Tax Paid | Tax Assessment Tax Assessment Total Assessment is a certain percentage of the fair market value that is determined by local assessors to be the total taxable value of land and additions on the property. | Land | Improvement |
|---|---|---|---|---|
| 2025 | $5,273 | $462,099 | $245,249 | $216,850 |
| 2023 | $5,273 | $444,158 | $235,727 | $208,431 |
| 2022 | $5,243 | $435,450 | $231,105 | $204,345 |
| 2021 | $4,940 | $426,913 | $226,574 | $200,339 |
| 2020 | $4,693 | $422,526 | $224,246 | $198,280 |
| 2019 | $4,772 | $414,242 | $219,849 | $194,393 |
| 2018 | $4,708 | $406,123 | $215,540 | $190,583 |
| 2017 | $4,454 | $398,160 | $211,314 | $186,846 |
| 2016 | $4,365 | $390,356 | $207,172 | $183,184 |
| 2015 | $4,295 | $384,496 | $204,062 | $180,434 |
| 2014 | $4,266 | $376,967 | $200,066 | $176,901 |
Source: Public Records
Map
Nearby Homes
- 575 S Whipple St
- 571 S Franklin St
- 494 S Whipple St
- 459 S Mcpherson St
- 854 Woodward St
- 300 N Harbor Dr
- 517 S Lincoln St
- 251 S Franklin St
- 142 S Franklin St
- 19351 Del Mar Dr
- 215 S Sanderson Way
- 423 N Franklin St
- 19171 S Harbor Dr
- 119 E Pine St
- 19701 Noyo Acres Dr
- 715 West St
- 944 Stewart St
- 924 Glass Beach Dr
- 32875 Simpson Ln
- 18451 N Highway 1