353 Deer Hollow Cir Centerville, UT 84014
Estimated Value: $638,000 - $812,000
--
Bed
4
Baths
2,443
Sq Ft
$310/Sq Ft
Est. Value
About This Home
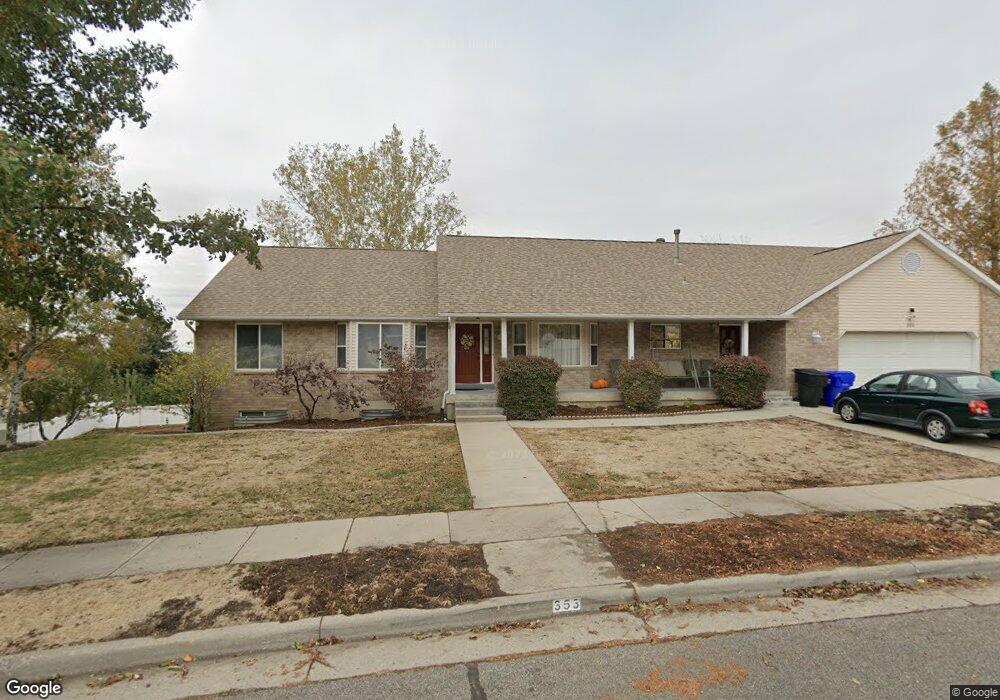
This home is located at 353 Deer Hollow Cir, Centerville, UT 84014 and is currently estimated at $757,378, approximately $310 per square foot. 353 Deer Hollow Cir is a home with nearby schools including Centerville Elementary, Centerville Jr High, and Viewmont High School.
Ownership History
Date
Name
Owned For
Owner Type
Purchase Details
Closed on
Jul 10, 2019
Sold by
Jensen Brian F and Jensen Diana H
Bought by
Jensen Brian F and Jensen Diana H
Current Estimated Value
Home Financials for this Owner
Home Financials are based on the most recent Mortgage that was taken out on this home.
Original Mortgage
$75,000
Outstanding Balance
$48,951
Interest Rate
3.9%
Mortgage Type
New Conventional
Estimated Equity
$708,427
Purchase Details
Closed on
Aug 24, 2016
Sold by
Jensen Brian F and Jensen Diana H
Bought by
Jensen Brian F and Jensen Diana H
Create a Home Valuation Report for This Property
The Home Valuation Report is an in-depth analysis detailing your home's value as well as a comparison with similar homes in the area
Home Values in the Area
Average Home Value in this Area
Purchase History
| Date | Buyer | Sale Price | Title Company |
|---|---|---|---|
| Jensen Brian F | -- | Meridian Title Com | |
| Jensen Diana H | -- | Meridian Title Com | |
| Jensen Brian F | -- | Attorney |
Source: Public Records
Mortgage History
| Date | Status | Borrower | Loan Amount |
|---|---|---|---|
| Open | Jensen Diana H | $75,000 |
Source: Public Records
Tax History Compared to Growth
Tax History
| Year | Tax Paid | Tax Assessment Tax Assessment Total Assessment is a certain percentage of the fair market value that is determined by local assessors to be the total taxable value of land and additions on the property. | Land | Improvement |
|---|---|---|---|---|
| 2025 | $4,410 | $421,850 | $189,790 | $232,060 |
| 2024 | $4,178 | $406,449 | $177,513 | $228,936 |
| 2023 | $4,022 | $388,850 | $155,130 | $233,719 |
| 2022 | $4,272 | $413,600 | $144,265 | $269,335 |
| 2021 | $3,740 | $564,000 | $230,747 | $333,253 |
| 2020 | $3,270 | $493,000 | $219,989 | $273,011 |
| 2019 | $3,321 | $489,000 | $203,276 | $285,724 |
| 2018 | $3,073 | $447,000 | $187,713 | $259,287 |
| 2016 | $2,808 | $226,985 | $73,056 | $153,929 |
| 2015 | $2,654 | $202,400 | $73,056 | $129,344 |
| 2014 | $2,257 | $176,110 | $73,056 | $103,054 |
| 2013 | -- | $181,327 | $57,274 | $124,053 |
Source: Public Records
Map
Nearby Homes
- 252 N 400 E
- 360 E 400 N
- 360 E Center St
- 266 E Center St
- 328 E 1100 S
- 527 Sheridan Cir
- 232 N 100 W
- 67 W Pheasantbrook Dr
- 88 W 50 S Unit Q12
- 88 W 50 S Unit A4
- 88 W 50 S Unit F9
- 171 W 650 N
- 22 Creekside Ln
- 775 Pheasantbrook Cir
- 281 W 650 N Unit C
- 117 Cara Vella Ln
- 2 S 285 W
- 147 W 925 N
- 147 N 360 W Unit 21
- 610 S 800 E