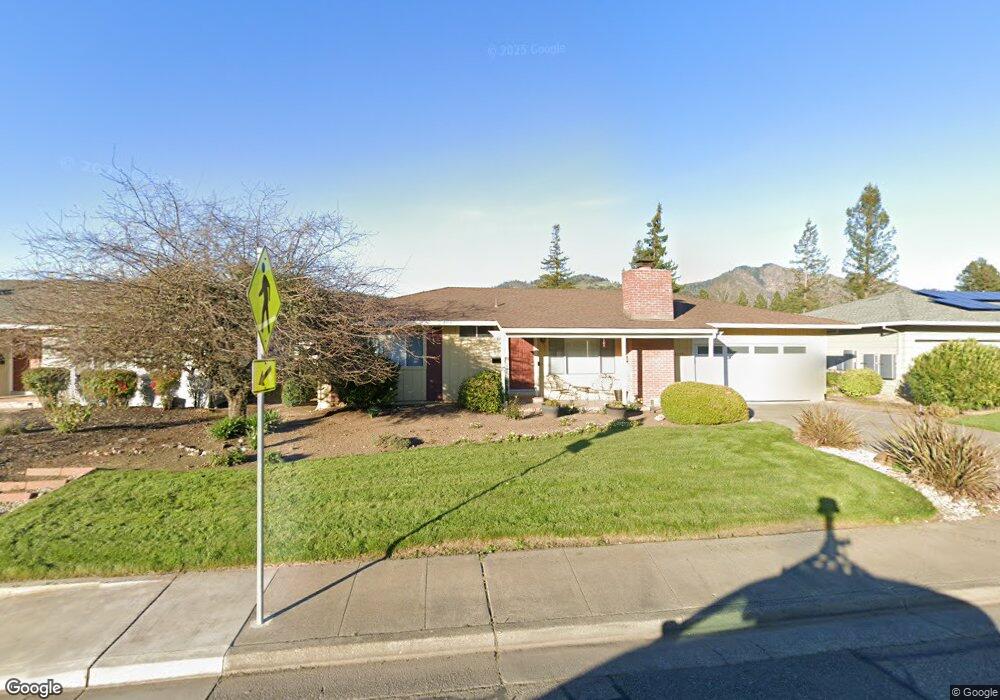
353 Laurel Leaf Place Santa Rosa, CA 95409
Oakmont Village NeighborhoodEstimated Value: $722,347 - $855,000
2
Beds
2
Baths
1,665
Sq Ft
$470/Sq Ft
Est. Value
About This Home
This home is located at 353 Laurel Leaf Place, Santa Rosa, CA 95409 and is currently estimated at $782,087, approximately $469 per square foot. 353 Laurel Leaf Place is a home located in Sonoma County with nearby schools including Austin Creek Elementary School, Rincon Valley Middle School, and Maria Carrillo High School.
Ownership History
Date
Name
Owned For
Owner Type
Purchase Details
Closed on
Feb 3, 2023
Sold by
Mills Jean
Bought by
Jeanie M Mills Living Trust
Current Estimated Value
Purchase Details
Closed on
Aug 4, 2020
Sold by
Harrell Iris F and Benson Anne
Bought by
Mills Jean and Harrell Iris F
Purchase Details
Closed on
Jan 12, 2018
Sold by
Meese Richard O and Meese Richard
Bought by
Harrell Iris F and Benson Ann E
Purchase Details
Closed on
Nov 27, 2017
Sold by
Meese Richard and 2016 Meese Family Trust
Bought by
Richard O & Virginia A Meese Trust
Purchase Details
Closed on
Nov 1, 2016
Sold by
Meese Richard O and Meese Virginia A
Bought by
Meese Richard O and Meese Virginia A
Purchase Details
Closed on
Jul 25, 2016
Sold by
Meese Richard O and Meese Virginia A
Bought by
Meese Richard O and Meese Virginia A
Purchase Details
Closed on
Dec 8, 2006
Sold by
Murphy James and Murphy Katherine
Bought by
Murphy James and Murphy Katherine
Purchase Details
Closed on
Sep 15, 1994
Sold by
Derego Carl and Canepa Albert B
Bought by
Meese Richard O and Meese Virginia A
Create a Home Valuation Report for This Property
The Home Valuation Report is an in-depth analysis detailing your home's value as well as a comparison with similar homes in the area
Home Values in the Area
Average Home Value in this Area
Purchase History
| Date | Buyer | Sale Price | Title Company |
|---|---|---|---|
| Jeanie M Mills Living Trust | -- | -- | |
| Mills Jean | -- | None Available | |
| Harrell Iris F | $660,000 | Fidelity National Title Co | |
| Richard O & Virginia A Meese Trust | -- | None Available | |
| Meese Richard O | -- | None Available | |
| Meese Richard O | -- | None Available | |
| Murphy James | -- | None Available | |
| Meese Richard O | $210,000 | North Bay Title |
Source: Public Records
Tax History Compared to Growth
Tax History
| Year | Tax Paid | Tax Assessment Tax Assessment Total Assessment is a certain percentage of the fair market value that is determined by local assessors to be the total taxable value of land and additions on the property. | Land | Improvement |
|---|---|---|---|---|
| 2025 | $8,713 | $750,962 | $227,563 | $523,399 |
| 2024 | $8,713 | $736,238 | $223,101 | $513,137 |
| 2023 | $8,713 | $721,803 | $218,727 | $503,076 |
| 2022 | $8,046 | $707,651 | $214,439 | $493,212 |
| 2021 | $7,888 | $693,777 | $210,235 | $483,542 |
| 2020 | $7,859 | $686,664 | $208,080 | $478,584 |
| 2019 | $7,789 | $673,200 | $204,000 | $469,200 |
| 2018 | $3,400 | $289,335 | $110,220 | $179,115 |
| 2017 | $3,337 | $283,662 | $108,059 | $175,603 |
| 2016 | $3,295 | $278,101 | $105,941 | $172,160 |
| 2015 | $3,195 | $273,924 | $104,350 | $169,574 |
| 2014 | $3,079 | $268,559 | $102,306 | $166,253 |
Source: Public Records
Map
Nearby Homes
- 2 Fallgreen Ct
- 319 Laurel Leaf Place
- 6620 Fairfield Dr
- 4 Valley Green St
- 607 Wild Oak Dr
- 6335 Pine Valley Dr
- 6828 Fairfield Dr
- 6749 Wintergreen Ct
- 6850 Oakmont Dr
- 316 Green Field Cir
- 6603 Stone Bridge Rd
- 6601 Stone Bridge Rd
- 6613 Stone Bridge Rd
- 6609 Stone Bridge Rd
- 425 Deerfield Cir
- 447 Meadowgreen Dr
- 12 Meadowgreen Cir
- 865 White Oak Dr
- 6417 Timber Springs Ct
- 827 Wild Oak Dr
- 349 Laurel Leaf Place
- 357 Laurel Leaf Place
- 6695 Oakmont Dr
- 6691 Oakmont Dr
- 6699 Oakmont Dr
- 345 Laurel Leaf Place
- 6687 Oakmont Dr
- 337 Laurel Leaf Place
- 6683 Oakmont Dr
- 331 Laurel Leaf Place
- 6702 Oakmont Dr
- 5 Fallgreen Ct
- 6698 Oakmont Dr
- 6706 Oakmont Dr
- 6694 Oakmont Dr
- 4 Fallgreen Ct
- 6710 Oakmont Dr
- 325 Laurel Leaf Place
- 6690 Oakmont Dr
- 6714 Oakmont Dr