Estimated Value: $336,339 - $453,000
--
Bed
3
Baths
2,740
Sq Ft
$140/Sq Ft
Est. Value
About This Home
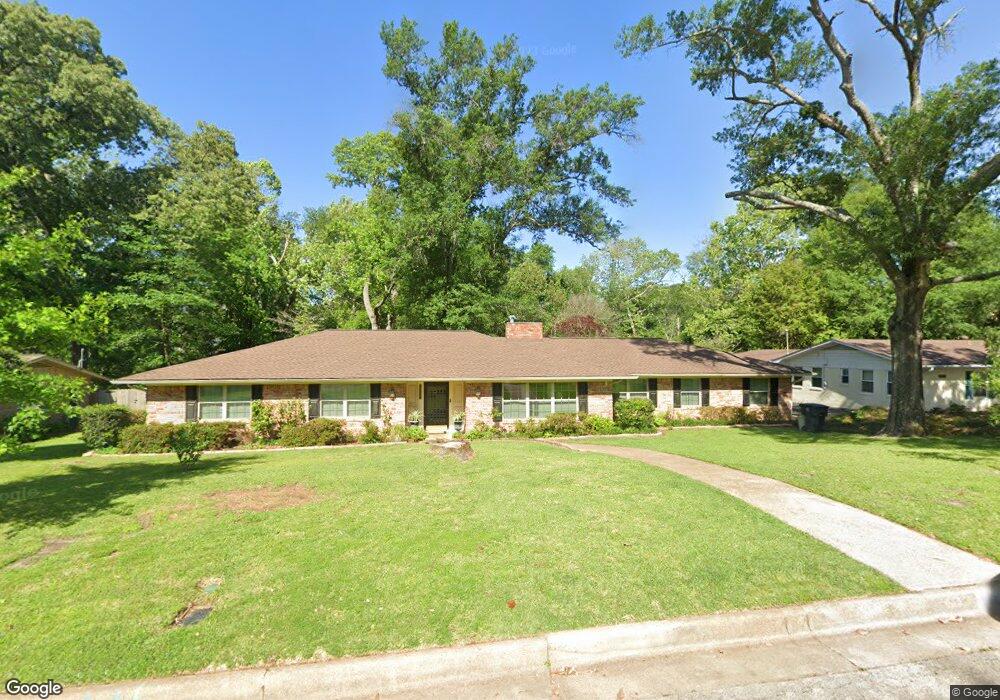
This home is located at 3533 Wynnwood Dr, Tyler, TX 75701 and is currently estimated at $384,585, approximately $140 per square foot. 3533 Wynnwood Dr is a home located in Smith County with nearby schools including Woods Elementary School, Hubbard Middle School, and Tyler Legacy High School.
Create a Home Valuation Report for This Property
The Home Valuation Report is an in-depth analysis detailing your home's value as well as a comparison with similar homes in the area
Home Values in the Area
Average Home Value in this Area
Tax History Compared to Growth
Tax History
| Year | Tax Paid | Tax Assessment Tax Assessment Total Assessment is a certain percentage of the fair market value that is determined by local assessors to be the total taxable value of land and additions on the property. | Land | Improvement |
|---|---|---|---|---|
| 2025 | $4,242 | $361,603 | $63,458 | $298,145 |
| 2024 | $4,242 | $307,905 | $37,629 | $322,003 |
| 2023 | $4,879 | $376,838 | $37,629 | $339,209 |
| 2022 | $4,985 | $282,197 | $32,253 | $249,944 |
| 2021 | $4,853 | $231,334 | $32,253 | $199,081 |
| 2020 | $4,888 | $228,407 | $32,253 | $196,154 |
| 2019 | $4,949 | $226,302 | $21,502 | $204,800 |
| 2018 | $4,592 | $211,121 | $21,502 | $189,619 |
| 2017 | $4,507 | $211,121 | $21,502 | $189,619 |
| 2016 | $4,451 | $208,498 | $21,502 | $186,996 |
| 2015 | $3,878 | $195,950 | $21,502 | $174,448 |
| 2014 | $3,878 | $194,224 | $21,502 | $172,722 |
Source: Public Records
Map
Nearby Homes
- 3712 Colony Park Dr
- 3511 S Keaton Ave
- 3710 Bain Place
- 3210 S Donnybrook Ave
- 3202 S Donnybrook Ave
- 4021 New Copeland Rd
- 3523 S Cameron Ave
- 1018 Pollard Dr
- 1113 E Amherst Dr
- 315 Ridgecrest Dr
- 1107 Pinedale Place
- 611 E Watkins St
- 1408 Westfield St
- 1101 Clyde Dr
- 204 Ridgecrest Dr
- 1024 Clyde Dr
- 905 E Watkins St
- 3300 Old Bullard Rd
- 3308 Greenoak Place
- 3006 de Charles St
- 3529 Wynnwood Dr
- 3537 Wynnwood Dr
- 3537 3537 Wynnwood
- 3600 New Copeland Rd
- 3521 3521 Wynnwood Dr
- 3600 3600 Wynnwood Dr
- 3521 Wynnwood Dr
- 3610 New Copeland Rd
- 3528 New Copeland Rd
- 3524 3524 Wynnwood Dr
- 3600 Wynnwood Dr
- 3528 3528 New Copeland Rd
- 3524 Wynnwood Dr
- 3610 Wynnwood Dr
- 3520 New Copeland Rd
- 3615 Wynnwood Dr
- 3520 Wynnwood Dr
- 3515 Wynnwood Dr
- 3618 New Copeland Rd
- 3618 3618 New Copeland Rd