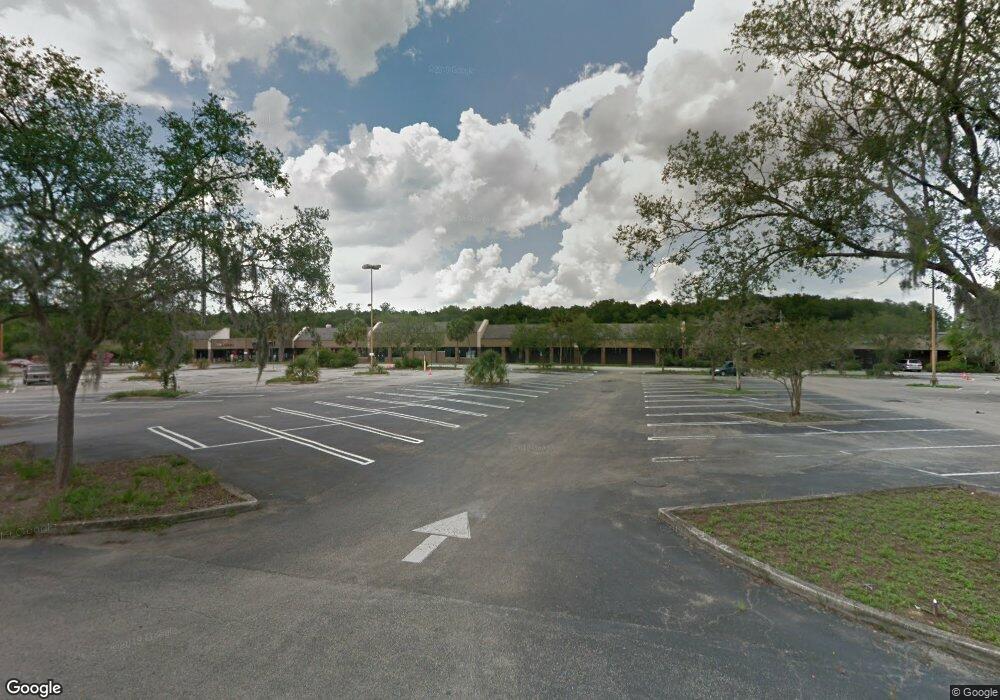
3535 SE Maricamp Rd Ocala, FL 34471
Southeast Ocala NeighborhoodEstimated Value: $1,196,192
--
Bed
3
Baths
1,600
Sq Ft
$748/Sq Ft
Est. Value
About This Home
This home is located at 3535 SE Maricamp Rd, Ocala, FL 34471 and is currently estimated at $1,196,192, approximately $747 per square foot. 3535 SE Maricamp Rd is a home located in Marion County with nearby schools including Maplewood Elementary School, Osceola Middle School, and Forest High School.
Ownership History
Date
Name
Owned For
Owner Type
Purchase Details
Closed on
Apr 8, 2025
Sold by
Jfp Maricamp Llc
Bought by
Ocala Maricamp Retail Investment Llc
Current Estimated Value
Purchase Details
Closed on
May 25, 2023
Sold by
Weekend Cowboy Investments Llc
Bought by
3537 Se Maricamp Llc
Purchase Details
Closed on
Jun 11, 2021
Sold by
Jfr Maricamp Llc
Bought by
Weekend Cowboy Investments Llc
Purchase Details
Closed on
Feb 13, 2020
Sold by
J & G Cedar Shores Sc & Dg Llc
Bought by
Jfp 36Th Llc
Purchase Details
Closed on
Jul 2, 2019
Sold by
Grannan Victoria Joiner
Bought by
J And G Cedar Shores Sc And Dg Llc
Purchase Details
Closed on
Sep 5, 2018
Sold by
Grannan Victor Joiner
Bought by
Grannan Victoria Joiner
Create a Home Valuation Report for This Property
The Home Valuation Report is an in-depth analysis detailing your home's value as well as a comparison with similar homes in the area
Home Values in the Area
Average Home Value in this Area
Purchase History
| Date | Buyer | Sale Price | Title Company |
|---|---|---|---|
| Ocala Maricamp Retail Investment Llc | $1,223,800 | None Listed On Document | |
| Ocala Maricamp Retail Investment Llc | $1,223,800 | None Listed On Document | |
| Ocala Maricamp Retail Investment Llc | $1,082,100 | None Listed On Document | |
| Ocala Maricamp Retail Investment Llc | $1,082,100 | None Listed On Document | |
| 3537 Se Maricamp Llc | $100 | None Listed On Document | |
| Weekend Cowboy Investments Llc | $2,554,000 | Attorney | |
| Weekend Cowboy Investments Llc | $2,554,000 | None Listed On Document | |
| Jfp Maricamp Llc | -- | Attorney | |
| Jfp Maricamp Llc | $100 | None Listed On Document | |
| Jfp 36Th Llc | $1,250,000 | Attorney | |
| J And G Cedar Shores Sc And Dg Llc | -- | Attorney | |
| Grannan Victoria Joiner | -- | Attorney | |
| Grannan Victoria Joiner | -- | Attorney |
Source: Public Records
Tax History Compared to Growth
Tax History
| Year | Tax Paid | Tax Assessment Tax Assessment Total Assessment is a certain percentage of the fair market value that is determined by local assessors to be the total taxable value of land and additions on the property. | Land | Improvement |
|---|---|---|---|---|
| 2024 | $18,894 | $1,082,032 | $1,038,470 | $43,562 |
| 2023 | $18,894 | $1,082,032 | $1,038,470 | $43,562 |
| 2022 | $19,082 | $1,082,032 | $1,038,470 | $43,562 |
| 2021 | $19,678 | $1,082,032 | $1,038,470 | $43,562 |
| 2020 | $20,508 | $1,121,607 | $1,046,835 | $74,772 |
| 2019 | $24,712 | $1,338,476 | $1,308,544 | $29,932 |
| 2018 | $19,429 | $1,069,118 | $982,050 | $87,068 |
| 2017 | $19,757 | $1,069,681 | $982,050 | $87,631 |
| 2016 | $20,725 | $1,108,400 | $0 | $0 |
| 2015 | $22,068 | $1,161,949 | $0 | $0 |
| 2014 | $22,226 | $1,257,241 | $0 | $0 |
Source: Public Records
Map
Nearby Homes
- 3720 SE 24th St
- 3707 SE 24th St
- 2404 SE 39th Ave
- 3101 SE 39th Ave
- 3106 SE 39th Ave
- 2901 SE 28th Ln
- 2012 SE 37th Court Cir
- 3692 SE 37th Ct
- Truman Plan at Oak Hammock Preserve Townhomes
- Lincoln Plan at Oak Hammock Preserve Townhomes
- 3660 SE 37th Ct
- 3226 SE 39th Ave
- 3225 SE 32nd Ave
- 6301 SE Maricamp Rd
- 3201 SE 34th St
- 4015 SE 22nd St
- 3601 SE 35th Ct
- 3331 SE 30th Terrace
- 3141 SE 42nd Ave
- 3122 SE 42nd Terrace
- 3535 SE Maricamp Rd Unit 303
- 3483 SE Maricamp Rd
- 2400 SE 36th Ave
- 2400 SE 36th Ave
- 3620 SE 24th St
- 3640 SE 24th St
- 3411 SE 31st St
- 3365 SE 31st St
- 3708 SE 24th St
- 3443 SE 31st St
- 3443 SE 31st St
- 3445 SE 31st St
- 3321 SE 31st St
- 3710 SE 24th St
- 3315 SE 31st St
- 3605 SE 24th St Unit 3607
- 3311 SE 31st St
- 3705 SE 24th St
- 3730 SE 24th St
- 3721 SE Maricamp Rd