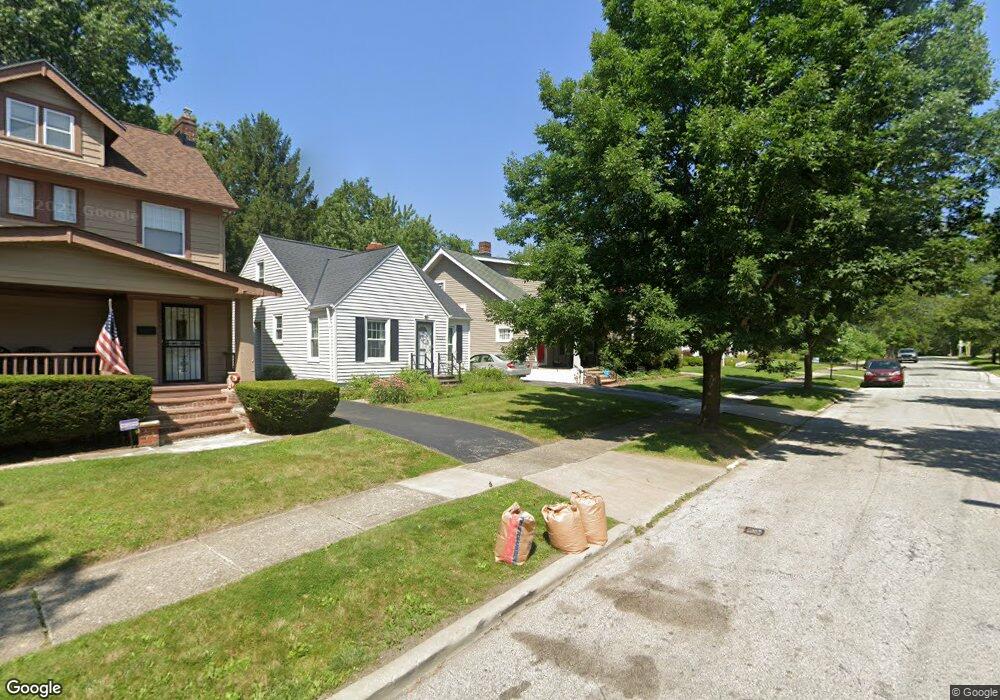
3537 E Scarborough Rd Cleveland, OH 44118
Estimated Value: $247,548 - $293,000
3
Beds
2
Baths
1,904
Sq Ft
$145/Sq Ft
Est. Value
About This Home
This home is located at 3537 E Scarborough Rd, Cleveland, OH 44118 and is currently estimated at $276,387, approximately $145 per square foot. 3537 E Scarborough Rd is a home located in Cuyahoga County with nearby schools including Canterbury Elementary School, Roxboro Middle School, and Cleveland Heights High School.
Ownership History
Date
Name
Owned For
Owner Type
Purchase Details
Closed on
Jul 27, 2001
Sold by
Kelly Lorri Reider
Bought by
Swartz Steven and Walker Diane
Current Estimated Value
Home Financials for this Owner
Home Financials are based on the most recent Mortgage that was taken out on this home.
Original Mortgage
$128,732
Outstanding Balance
$50,180
Interest Rate
7.14%
Mortgage Type
FHA
Estimated Equity
$226,207
Purchase Details
Closed on
Jun 11, 1998
Sold by
Strittmatter Charles W and Strittmatter Ruth W
Bought by
Kelly Lorri Reider
Home Financials for this Owner
Home Financials are based on the most recent Mortgage that was taken out on this home.
Original Mortgage
$100,511
Interest Rate
7.32%
Mortgage Type
FHA
Purchase Details
Closed on
Mar 18, 1985
Sold by
Strittmatter Charles W and R W
Bought by
Strittmatter Charles W
Purchase Details
Closed on
Jan 1, 1975
Bought by
Strittmatter Charles W and R W
Create a Home Valuation Report for This Property
The Home Valuation Report is an in-depth analysis detailing your home's value as well as a comparison with similar homes in the area
Home Values in the Area
Average Home Value in this Area
Purchase History
| Date | Buyer | Sale Price | Title Company |
|---|---|---|---|
| Swartz Steven | $129,800 | Great Lakes Title Agency Inc | |
| Kelly Lorri Reider | $101,000 | -- | |
| Strittmatter Charles W | -- | -- | |
| Strittmatter Charles W | -- | -- |
Source: Public Records
Mortgage History
| Date | Status | Borrower | Loan Amount |
|---|---|---|---|
| Open | Swartz Steven | $128,732 | |
| Closed | Kelly Lorri Reider | $100,511 |
Source: Public Records
Tax History Compared to Growth
Tax History
| Year | Tax Paid | Tax Assessment Tax Assessment Total Assessment is a certain percentage of the fair market value that is determined by local assessors to be the total taxable value of land and additions on the property. | Land | Improvement |
|---|---|---|---|---|
| 2024 | $6,301 | $74,550 | $12,775 | $61,775 |
| 2023 | $5,596 | $51,660 | $9,730 | $41,930 |
| 2022 | $5,567 | $51,660 | $9,730 | $41,930 |
| 2021 | $5,454 | $51,660 | $9,730 | $41,930 |
| 2020 | $5,387 | $46,130 | $8,680 | $37,450 |
| 2019 | $5,088 | $131,800 | $24,800 | $107,000 |
| 2018 | $5,274 | $46,130 | $8,680 | $37,450 |
| 2017 | $5,767 | $48,690 | $8,510 | $40,180 |
| 2016 | $5,756 | $48,690 | $8,510 | $40,180 |
| 2015 | $5,055 | $48,690 | $8,510 | $40,180 |
| 2014 | $5,055 | $45,090 | $7,880 | $37,210 |
Source: Public Records
Map
Nearby Homes
- 3528 Meadowbrook Blvd
- 3609 E Scarborough Rd
- 2482 Princeton Rd
- 3540 Silsby Rd
- 2423 Eaton Rd
- 3485 Silsby Rd
- 3705 Meadowbrook Blvd
- 2272 S Taylor Rd
- 2235 Brockway Rd
- 3343 E Scarborough Rd
- 3593 Tullamore Rd
- 2619 Kingston Rd
- 3365 Meadowbrook Blvd
- 3333 Ormond Rd
- 3368 Silsby Rd
- 2227 Cranston Rd
- 2203 Brockway Rd
- 2551 Ashurst Rd
- 3323 E Fairfax Rd
- 3395 Tullamore Rd
- 3535 E Scarborough Rd
- 3549 E Scarborough Rd
- 3533 E Scarborough Rd
- 3529 E Scarborough Rd
- 3553 E Scarborough Rd
- 2419 Kingston Rd
- 3557 E Scarborough Rd
- 3544 Meadowbrook Blvd
- 3548 Meadowbrook Blvd
- 3532 Meadowbrook Blvd
- 2425 Kingston Rd
- 3536 Meadowbrook Blvd
- 3561 E Scarborough Rd
- 3552 Meadowbrook Blvd
- 2409 Rinard Rd
- 2401 Rinard Rd
- 2397 Rinard Rd
- 2418 Kingston Rd
- 2429 Kingston Rd
- 2393 Rinard Rd