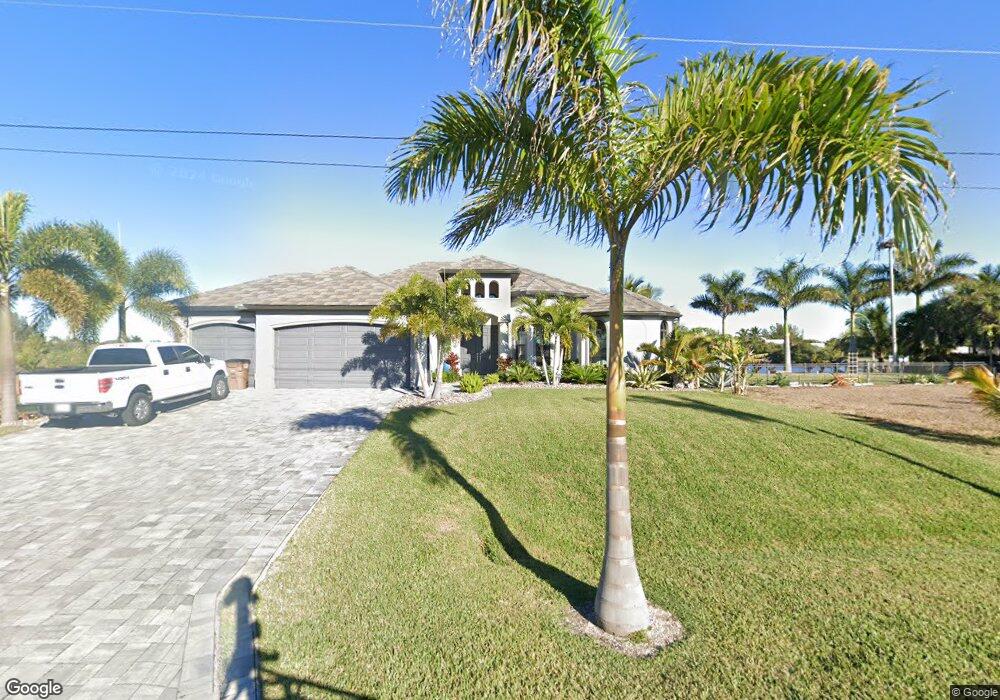
3539 NW 21st Terrace Cape Coral, FL 33993
Burnt Store NeighborhoodEstimated Value: $773,000 - $1,193,000
3
Beds
3
Baths
2,345
Sq Ft
$400/Sq Ft
Est. Value
About This Home
This home is located at 3539 NW 21st Terrace, Cape Coral, FL 33993 and is currently estimated at $937,727, approximately $399 per square foot. 3539 NW 21st Terrace is a home located in Lee County with nearby schools including Caloosa Elementary School, Dr. Carrie D. Robinson Littleton Elementary School, and Tropic Isles Elementary School.
Ownership History
Date
Name
Owned For
Owner Type
Purchase Details
Closed on
Jun 22, 2020
Sold by
Tarbell Jeffrey and Tarbell Lisa Susan
Bought by
Maggied Jeffrey B and Maggied Shannan M
Current Estimated Value
Home Financials for this Owner
Home Financials are based on the most recent Mortgage that was taken out on this home.
Original Mortgage
$406,250
Outstanding Balance
$357,846
Interest Rate
2.87%
Mortgage Type
New Conventional
Estimated Equity
$579,881
Purchase Details
Closed on
Jun 16, 2014
Sold by
Corricelli Albert D
Bought by
Tarbell Jeffrey and Tarbell Lisa Susan
Purchase Details
Closed on
Mar 12, 2007
Sold by
Casola Lawrence A and Casola Elaine M
Bought by
Corricelli Albert D
Purchase Details
Closed on
Sep 22, 2004
Sold by
Barr Jack A and Barr Suzanne
Bought by
Casola Lawrence A and Casola Elaine M
Create a Home Valuation Report for This Property
The Home Valuation Report is an in-depth analysis detailing your home's value as well as a comparison with similar homes in the area
Home Values in the Area
Average Home Value in this Area
Purchase History
| Date | Buyer | Sale Price | Title Company |
|---|---|---|---|
| Maggied Jeffrey B | $625,000 | Palm Title Associates Inc | |
| Tarbell Jeffrey | $85,000 | Palm Title Associates Inc | |
| Corricelli Albert D | $185,000 | Towns Title & Co Inc | |
| Casola Lawrence A | $208,700 | Fidelity National Title Ins |
Source: Public Records
Mortgage History
| Date | Status | Borrower | Loan Amount |
|---|---|---|---|
| Open | Maggied Jeffrey B | $406,250 |
Source: Public Records
Tax History Compared to Growth
Tax History
| Year | Tax Paid | Tax Assessment Tax Assessment Total Assessment is a certain percentage of the fair market value that is determined by local assessors to be the total taxable value of land and additions on the property. | Land | Improvement |
|---|---|---|---|---|
| 2025 | $8,987 | $569,545 | -- | -- |
| 2024 | $8,779 | $553,494 | -- | -- |
| 2023 | $8,779 | $537,373 | $0 | $0 |
| 2022 | $8,363 | $521,721 | $0 | $0 |
| 2021 | $8,747 | $506,525 | $104,046 | $402,479 |
| 2020 | $7,124 | $398,850 | $0 | $0 |
| 2019 | $6,831 | $384,370 | $79,000 | $305,370 |
| 2018 | $1,553 | $71,000 | $71,000 | $0 |
| 2017 | $1,534 | $69,041 | $69,041 | $0 |
| 2016 | $1,503 | $65,000 | $65,000 | $0 |
| 2015 | $1,516 | $65,000 | $65,000 | $0 |
| 2014 | $906 | $47,000 | $47,000 | $0 |
| 2013 | -- | $26,400 | $26,400 | $0 |
Source: Public Records
Map
Nearby Homes
- 3548 NW 21st Terrace
- 2712 NW 21st Terrace
- 3521 NW 21st Terrace
- 3552 NW 21st Terrace
- 2002 NW 36th Ave
- 3506 NW 23rd St
- 2218 NW 37th Place
- 3414 NW 21st St
- 2306 NW 37th Place
- 2309 NW 37th Place
- 1939 NW 34th Place
- 2325 NW 36th Place
- 2330 NW 36th Ave
- 2311 NW 35th Ave
- 2328 NW 35th Place
- 2333 NW 36th Ave
- 2332 NW 35th Place
- 2336 NW 35th Place
- 2312 NW 34th Ave Unit 18
- 2304 NW 38th Ave
- 3543 NW 21st Terrace
- 3547 NW 21st Terrace
- 3551 NW 21st Terrace
- 1018 NW 21st Terrace
- 3535 NW 21st Terrace
- 3531 NW 21st Terrace
- 3536 NW 21st Terrace
- 3528 NW 21st Terrace
- 3540 NW 21st Terrace
- 3520 NW 21st Terrace
- 3527 NW 21st Terrace
- 3524 NW 21st Terrace Unit 15 + 16
- 3524 NW 21st Terrace
- 3544 NW 21st Terrace
- 3533 NW 21st St
- 3525 NW 21st St
- 3537 NW 21st St
- 3618 NW 22nd Terrace
- 3626 NW 22nd Terrace
- 3519 NW 21st Terrace