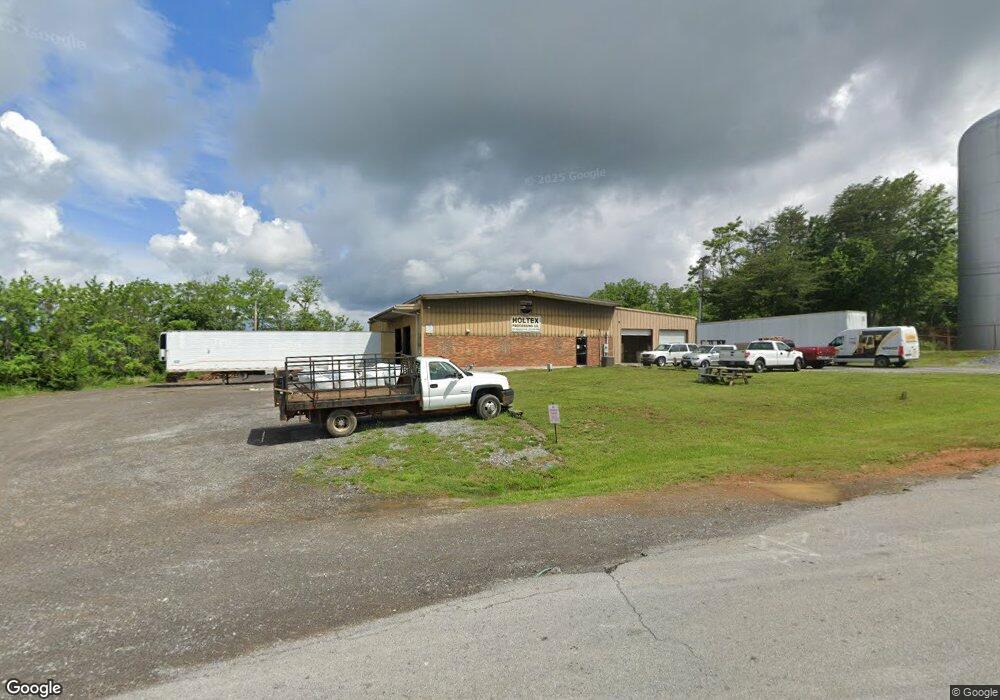
354 Industrial Ave Unit 50R& Morristown, TN 37813
Estimated Value: $287,693
--
Bed
2
Baths
8,000
Sq Ft
$36/Sq Ft
Est. Value
About This Home
This home is located at 354 Industrial Ave Unit 50R&, Morristown, TN 37813 and is currently estimated at $287,693, approximately $35 per square foot. 354 Industrial Ave Unit 50R& is a home located in Hamblen County with nearby schools including Russellville Elementary School, East Ridge Middle School, and Morristown East High School.
Ownership History
Date
Name
Owned For
Owner Type
Purchase Details
Closed on
Mar 13, 2015
Sold by
M & T Bank
Bought by
Hollmar Llc
Current Estimated Value
Purchase Details
Closed on
Jan 14, 2015
Sold by
Federal Home Loan Mortgage Corporation
Bought by
M & T Bank and C/O Bayview Loan Servicing Llc
Purchase Details
Closed on
Oct 2, 2014
Sold by
Robish Richard
Bought by
Federal Home Loan Mortgage Corporation
Purchase Details
Closed on
Jan 25, 2008
Sold by
Tenn Rentals
Bought by
Robish Richard P
Purchase Details
Closed on
Oct 22, 2007
Sold by
Warehouse And Industrial B
Bought by
Robish Richard P
Purchase Details
Closed on
Jun 6, 2006
Bought by
Warehouse And Industrial Builders %George Hag
Purchase Details
Closed on
Feb 1, 1993
Bought by
Warehouse And Industrial
Purchase Details
Closed on
Jan 10, 1991
Bought by
Warehouse And Industrial
Purchase Details
Closed on
Jan 17, 1990
Bought by
Cloer Cloer N and Cloer Nancy S
Purchase Details
Closed on
Dec 2, 1977
Bought by
Cloer Cloer N and Cloer Charles C
Create a Home Valuation Report for This Property
The Home Valuation Report is an in-depth analysis detailing your home's value as well as a comparison with similar homes in the area
Home Values in the Area
Average Home Value in this Area
Purchase History
| Date | Buyer | Sale Price | Title Company |
|---|---|---|---|
| Hollmar Llc | $100,000 | -- | |
| Hollmor Llc | $1,000 | -- | |
| M & T Bank | -- | -- | |
| Federal Home Loan Mortgage Corporation | $120,517 | -- | |
| Robish Richard P | -- | -- | |
| Robish Richard P | $155,000 | -- | |
| Warehouse And Industrial Builders %George Hag | $1,400 | -- | |
| Warehouse And Industrial | -- | -- | |
| Warehouse And Industrial | $66,000 | -- | |
| Cloer Cloer N | -- | -- | |
| Cloer Cloer N | $6,900 | -- |
Source: Public Records
Tax History Compared to Growth
Tax History
| Year | Tax Paid | Tax Assessment Tax Assessment Total Assessment is a certain percentage of the fair market value that is determined by local assessors to be the total taxable value of land and additions on the property. | Land | Improvement |
|---|---|---|---|---|
| 2024 | $981 | $55,760 | $11,720 | $44,040 |
| 2023 | $981 | $55,760 | $0 | $0 |
| 2022 | $1,762 | $55,760 | $11,720 | $44,040 |
| 2021 | $1,762 | $55,760 | $11,720 | $44,040 |
| 2020 | $1,759 | $55,760 | $11,720 | $44,040 |
| 2019 | $1,827 | $53,760 | $11,200 | $42,560 |
| 2018 | $1,693 | $53,760 | $11,200 | $42,560 |
| 2017 | $1,250 | $40,320 | $11,200 | $29,120 |
| 2016 | $1,194 | $40,320 | $11,200 | $29,120 |
| 2015 | $1,006 | $36,520 | $11,200 | $25,320 |
| 2014 | -- | $36,520 | $11,200 | $25,320 |
| 2013 | -- | $37,480 | $0 | $0 |
Source: Public Records
Map
Nearby Homes
- 00 Shinbone E Sugar Hollow Rd
- 670 Jones Franklin Rd
- 233 Harvey Dr
- 354 Volunteer Dr
- 505 Mary St
- 5740 Dodson Ferry Rd
- 4705 E Hampton Blvd
- 770 Harvey Dr
- 4458 Brockland Dr
- 5085 Old Kentucky Rd
- 5790 N 2nd St
- 4581 Lockley Ct
- 4907 Barton Springs Dr
- 288 Fuller Estate Cir
- 4510 Westover Place
- 1342 Slop Creek Rd
- 354 Industrial Ave
- 401 Hamblen Ave
- 328 Hamblen Ave
- 430 Berg Ln
- 5524 Jeffrey Ln
- 5599 Jeffrey Ln
- 585 Shinbone Rd
- 601 Shinbone Rd
- 5553 Jeffrey Ln
- 698 Shinbone Rd
- 700 Shinbone Rd
- 5400 E Andrew Johnson Hwy
- 5350 E Andrew Johnson Hwy
- 5504 E Andrew Johnson Hwy
- 5585 Jeffrey Ln
- 00 Hollow
- 5544 E Sugar Hollow Rd
- 549 Jones Franklin Rd
- 5594 E Sugar Hollow Rd
- 5534 E Sugar Hollow Rd