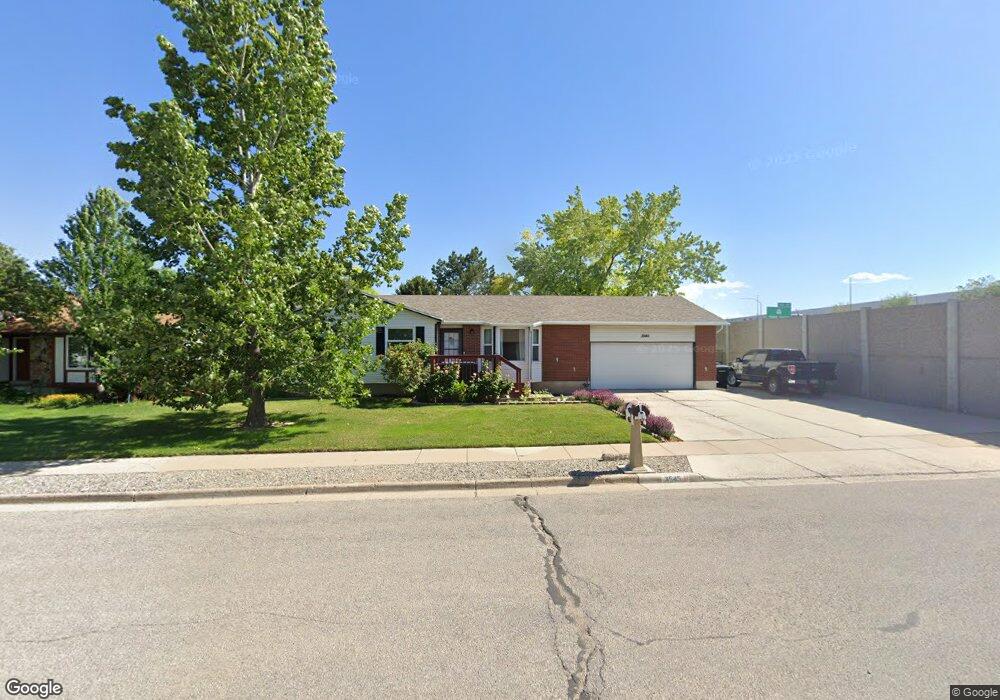
3545 W Farrington Ct West Jordan, UT 84084
Estimated Value: $526,000 - $583,000
6
Beds
3
Baths
2,508
Sq Ft
$221/Sq Ft
Est. Value
About This Home
This home is located at 3545 W Farrington Ct, West Jordan, UT 84084 and is currently estimated at $554,331, approximately $221 per square foot. 3545 W Farrington Ct is a home located in Salt Lake County with nearby schools including Oquirrh Elementary School, Joel P. Jensen Middle School, and West Jordan High School.
Ownership History
Date
Name
Owned For
Owner Type
Purchase Details
Closed on
Mar 17, 2015
Sold by
Smith Justin
Bought by
Smith Justin and Smith Alisha
Current Estimated Value
Home Financials for this Owner
Home Financials are based on the most recent Mortgage that was taken out on this home.
Original Mortgage
$247,713
Outstanding Balance
$189,933
Interest Rate
3.71%
Mortgage Type
VA
Estimated Equity
$364,398
Purchase Details
Closed on
Apr 11, 2008
Sold by
Trentman John L
Bought by
Trentman John L and Trentman Jenni L
Home Financials for this Owner
Home Financials are based on the most recent Mortgage that was taken out on this home.
Original Mortgage
$12,000
Interest Rate
5.38%
Mortgage Type
Stand Alone Second
Purchase Details
Closed on
Jan 8, 2008
Sold by
Trentman John L and Trentman John L
Bought by
Trentman John L and Trentman John L
Home Financials for this Owner
Home Financials are based on the most recent Mortgage that was taken out on this home.
Original Mortgage
$195,000
Interest Rate
6.05%
Mortgage Type
New Conventional
Purchase Details
Closed on
Dec 28, 2006
Sold by
Trentman John L
Bought by
Trentman John L and Trentman John L
Purchase Details
Closed on
Mar 14, 2006
Sold by
Equity Capital Group
Bought by
Trentman John L
Home Financials for this Owner
Home Financials are based on the most recent Mortgage that was taken out on this home.
Original Mortgage
$152,000
Interest Rate
6.19%
Mortgage Type
New Conventional
Purchase Details
Closed on
Jan 26, 2006
Sold by
Hales Roger L and Hales Jamie L
Bought by
Equity Capital Group
Home Financials for this Owner
Home Financials are based on the most recent Mortgage that was taken out on this home.
Original Mortgage
$152,000
Interest Rate
6.19%
Mortgage Type
New Conventional
Purchase Details
Closed on
Nov 29, 2001
Sold by
Jackson John T
Bought by
Hales Roger L and Hales Jamie L
Home Financials for this Owner
Home Financials are based on the most recent Mortgage that was taken out on this home.
Original Mortgage
$144,942
Interest Rate
6.63%
Mortgage Type
FHA
Purchase Details
Closed on
Oct 1, 1999
Sold by
Jackson John T and Jackson Katherine A
Bought by
Jackson John T
Home Financials for this Owner
Home Financials are based on the most recent Mortgage that was taken out on this home.
Original Mortgage
$126,250
Interest Rate
8.62%
Purchase Details
Closed on
Feb 24, 1997
Sold by
Thompson Lawrence E and Thompson Sharon A
Bought by
Jackson John T and Jackson Katherine A
Home Financials for this Owner
Home Financials are based on the most recent Mortgage that was taken out on this home.
Original Mortgage
$123,842
Interest Rate
7.85%
Mortgage Type
FHA
Create a Home Valuation Report for This Property
The Home Valuation Report is an in-depth analysis detailing your home's value as well as a comparison with similar homes in the area
Home Values in the Area
Average Home Value in this Area
Purchase History
| Date | Buyer | Sale Price | Title Company |
|---|---|---|---|
| Smith Justin | -- | Accommodation | |
| Smith Justin | -- | Absolute Title Ins Agcy Inc | |
| Trentman John L | -- | Service Link | |
| Trentman John L | -- | United Title Services | |
| Trentman John L | -- | United Title Services | |
| Trentman John L | -- | Accommodation | |
| Trentman John L | -- | Bonneville Superior Title | |
| Equity Capital Group | $155,183 | Inwest Title Services | |
| Hales Roger L | -- | Title One | |
| Jackson John T | -- | First American Title | |
| Jackson John T | -- | First American Title |
Source: Public Records
Mortgage History
| Date | Status | Borrower | Loan Amount |
|---|---|---|---|
| Open | Smith Justin | $247,713 | |
| Previous Owner | Trentman John L | $12,000 | |
| Previous Owner | Trentman John L | $195,000 | |
| Previous Owner | Trentman John L | $152,000 | |
| Previous Owner | Equity Capital Group | $100,000 | |
| Previous Owner | Hales Roger L | $144,942 | |
| Previous Owner | Jackson John T | $126,250 | |
| Previous Owner | Jackson John T | $123,842 |
Source: Public Records
Tax History Compared to Growth
Tax History
| Year | Tax Paid | Tax Assessment Tax Assessment Total Assessment is a certain percentage of the fair market value that is determined by local assessors to be the total taxable value of land and additions on the property. | Land | Improvement |
|---|---|---|---|---|
| 2025 | $2,442 | $489,800 | $127,000 | $362,800 |
| 2024 | $2,442 | $469,800 | $121,700 | $348,100 |
| 2023 | $2,455 | $445,200 | $114,800 | $330,400 |
| 2022 | $2,416 | $431,000 | $120,000 | $311,000 |
| 2021 | $2,030 | $329,600 | $92,000 | $237,600 |
| 2020 | $1,919 | $292,500 | $92,000 | $200,500 |
| 2019 | $1,918 | $286,600 | $72,000 | $214,600 |
| 2018 | $1,806 | $267,700 | $69,500 | $198,200 |
| 2017 | $1,666 | $245,800 | $69,500 | $176,300 |
| 2016 | $1,609 | $223,100 | $69,500 | $153,600 |
| 2015 | $1,315 | $177,800 | $68,900 | $108,900 |
| 2014 | $1,297 | $172,600 | $67,600 | $105,000 |
Source: Public Records
Map
Nearby Homes
- 7122 S Wood Green Rd
- 3422 Briar Dr
- 7611 S Springbrook Dr
- 3354 W 7800 S
- 6980 S 3535 W Unit 2
- 3629 W 7825 S
- 6968 S 3535 W Unit 3
- 6992 W Terraine Rd
- 6978 W Terraine Rd
- 7604 S Autumn Dr
- 3647 W 7865 S
- 3476 W Spaulding Rd
- 3165 W 7720 S
- 6894 S 3420 W
- 3383 W 6880 S
- 6863 S Dixie Dr
- 3546 W 7980 S
- 2886 W 7550 S
- 7989 S 3725 W
- 6893 S 3200 W
- 3545 Farrington Ct
- 3535 Farrington Ct
- 3535 W Farrington Ct
- 3536 W Charing Cross Rd
- 3536 Charing Cross Rd
- 3544 Charing Cross Rd
- 3527 Farrington Ct
- 3544 Farrington Ct
- 3534 Farrington Ct
- 3528 Charing Cross Rd
- 3528 W Charing Cross Rd
- 3524 Farrington Ct
- 3524 W Farrington Ct
- 3519 Farrington Ct
- 3519 W 7380 S
- 3543 Charing Cross Rd
- 3543 W Charing Cross Rd
- 3520 Charing Cross Rd
- 3520 W Charing Cross Rd
- 3527 W 7340 S