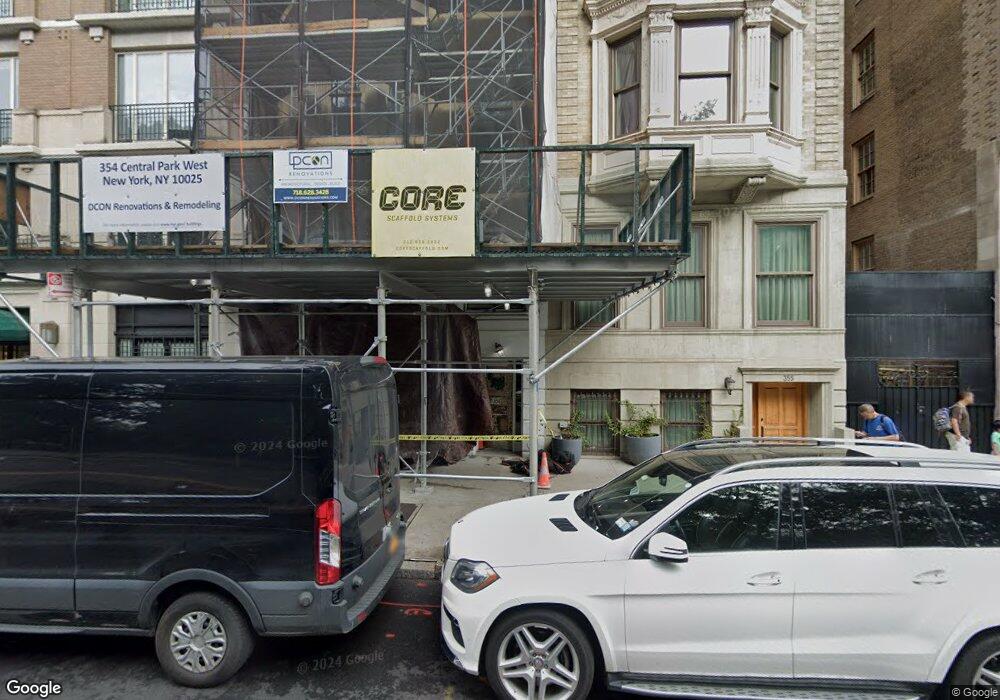
355 Central Park W New York, NY 10025
Upper West Side NeighborhoodEstimated Value: $3,884,000 - $8,987,774
--
Bed
--
Bath
5,084
Sq Ft
$1,369/Sq Ft
Est. Value
About This Home
This home is located at 355 Central Park W, New York, NY 10025 and is currently estimated at $6,959,694, approximately $1,368 per square foot. 355 Central Park W is a home located in New York County with nearby schools including P.S. 163 - Alfred E. Smith, Harlem Link Charter School, and Harlem Village Academy West Lower Elementary.
Ownership History
Date
Name
Owned For
Owner Type
Purchase Details
Closed on
Aug 7, 2009
Sold by
Cpw Capital Investors Llc
Bought by
Rothschild Andrew C and Rothschild Barbara B
Current Estimated Value
Home Financials for this Owner
Home Financials are based on the most recent Mortgage that was taken out on this home.
Original Mortgage
$4,340,000
Outstanding Balance
$2,851,278
Interest Rate
5.36%
Mortgage Type
Purchase Money Mortgage
Estimated Equity
$4,108,416
Purchase Details
Closed on
Dec 5, 2006
Sold by
Bershatsky Charles and Bershatsky Deborah
Bought by
Cpw Capital Investors Llc
Purchase Details
Closed on
Aug 2, 2001
Sold by
Gershberg Myron R and Gershberg Raquel
Bought by
Bershatsky Charles and Bershatsky Deborah
Home Financials for this Owner
Home Financials are based on the most recent Mortgage that was taken out on this home.
Original Mortgage
$1,132,990
Interest Rate
6.98%
Create a Home Valuation Report for This Property
The Home Valuation Report is an in-depth analysis detailing your home's value as well as a comparison with similar homes in the area
Home Values in the Area
Average Home Value in this Area
Purchase History
| Date | Buyer | Sale Price | Title Company |
|---|---|---|---|
| Rothschild Andrew C | $6,200,000 | -- | |
| Cpw Capital Investors Llc | $4,750,000 | -- | |
| Bershatsky Charles | -- | -- |
Source: Public Records
Mortgage History
| Date | Status | Borrower | Loan Amount |
|---|---|---|---|
| Open | Rothschild Andrew C | $4,340,000 | |
| Previous Owner | Bershatsky Charles | $1,132,990 |
Source: Public Records
Tax History Compared to Growth
Tax History
| Year | Tax Paid | Tax Assessment Tax Assessment Total Assessment is a certain percentage of the fair market value that is determined by local assessors to be the total taxable value of land and additions on the property. | Land | Improvement |
|---|---|---|---|---|
| 2025 | $48,635 | $255,547 | $125,400 | $130,147 |
| 2024 | $48,635 | $242,147 | $244,080 | $118,645 |
| 2023 | $47,793 | $237,953 | $128,194 | $109,759 |
| 2022 | $42,521 | $457,740 | $244,080 | $213,660 |
| 2021 | $44,819 | $491,880 | $244,080 | $247,800 |
| 2020 | $45,076 | $480,120 | $244,080 | $236,040 |
| 2019 | $42,212 | $532,080 | $244,080 | $288,000 |
| 2018 | $40,422 | $198,294 | $104,018 | $94,276 |
| 2017 | $38,134 | $187,070 | $115,373 | $71,697 |
| 2016 | $35,478 | $177,472 | $93,035 | $84,437 |
| 2015 | $21,285 | $177,463 | $130,662 | $46,801 |
| 2014 | $21,285 | $168,158 | $121,147 | $47,011 |
Source: Public Records
Map
Nearby Homes
- 360 Central Park W Unit 8A/9A
- 360 Central Park W Unit 11C
- 360 Central Park W Unit 2B
- 360 Central Park W Unit 6K
- 360 Central Park W Unit 15-C
- 12 W 96th St Unit 2D
- 12 W 96th St Unit 1A
- 6 W 95th St
- 7 W 96th St Unit A
- 7 W 96th St Unit PHA
- 15 W 96th St Unit 20
- 15 W 96th St Unit 10
- 15 W 96th St Unit PH
- 15 W 96th St Unit 19
- 15 W 96th St Unit 18
- 15 W 96th St Unit 11
- 26 W 95th St
- 370 Central Park W Unit 108
- 370 Central Park W Unit 413
- 370 Central Park W Unit 113
- 354 Central Park W Unit 4
- 354 Central Park W Unit 3
- 354 Central Park W Unit 1
- 354 Central Park W Unit 5
- 354 Central Park W Unit 2
- 354 Central Park W
- 356 Central Park W Unit C15G
- 6 W 96th St
- 356 Central Park W Unit C15EF
- 356 Central Park W
- 353 Central Park W Unit 6
- 353 Central Park W Unit 2
- 353 Central Park W Unit 19
- 353 Central Park W Unit 18
- 353 Central Park W Unit 17
- 353 Central Park W Unit 16
- 353 Central Park W Unit 15
- 353 Central Park W Unit 14
- 353 Central Park W Unit 12
- 353 Central Park W Unit 11