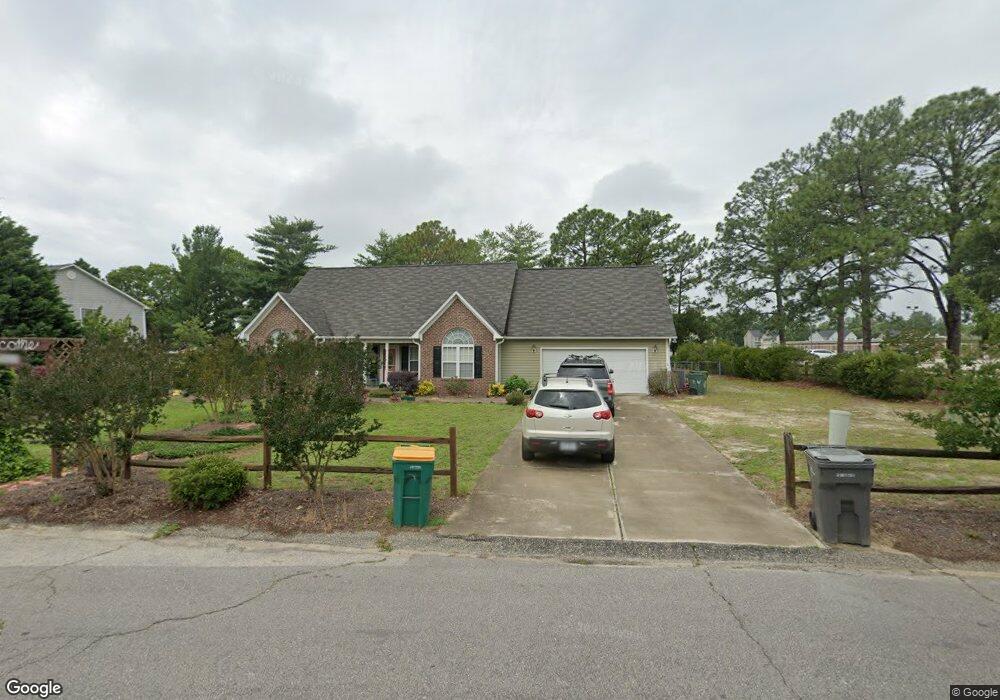
3552 Sturbridge Dr Hope Mills, NC 28348
South View NeighborhoodEstimated Value: $297,000 - $313,029
4
Beds
3
Baths
2,300
Sq Ft
$133/Sq Ft
Est. Value
About This Home
This home is located at 3552 Sturbridge Dr, Hope Mills, NC 28348 and is currently estimated at $305,007, approximately $132 per square foot. 3552 Sturbridge Dr is a home located in Cumberland County with nearby schools including C Wayne Collier Elementary, Hope Mills Middle, and South View High.
Ownership History
Date
Name
Owned For
Owner Type
Purchase Details
Closed on
Jan 8, 2024
Sold by
Reese William Norwood and Reese Herminia F
Bought by
Reese Herminia F
Current Estimated Value
Home Financials for this Owner
Home Financials are based on the most recent Mortgage that was taken out on this home.
Original Mortgage
$209,407
Outstanding Balance
$205,926
Interest Rate
7.22%
Mortgage Type
VA
Estimated Equity
$99,082
Purchase Details
Closed on
Sep 9, 2020
Sold by
Reese William N and Reese Herminia F
Bought by
Reese William Norwood and Reese Herminia F
Home Financials for this Owner
Home Financials are based on the most recent Mortgage that was taken out on this home.
Original Mortgage
$163,400
Interest Rate
2.9%
Mortgage Type
VA
Purchase Details
Closed on
Sep 15, 2006
Sold by
Dwayne Maxwell Inc
Bought by
Reese William N
Home Financials for this Owner
Home Financials are based on the most recent Mortgage that was taken out on this home.
Original Mortgage
$203,250
Interest Rate
6.52%
Mortgage Type
VA
Create a Home Valuation Report for This Property
The Home Valuation Report is an in-depth analysis detailing your home's value as well as a comparison with similar homes in the area
Home Values in the Area
Average Home Value in this Area
Purchase History
| Date | Buyer | Sale Price | Title Company |
|---|---|---|---|
| Reese Herminia F | -- | None Listed On Document | |
| Reese Herminia F | -- | None Listed On Document | |
| Reese William Norwood | -- | None Available | |
| Reese William N | $199,000 | -- |
Source: Public Records
Mortgage History
| Date | Status | Borrower | Loan Amount |
|---|---|---|---|
| Open | Reese Herminia F | $209,407 | |
| Closed | Reese Herminia F | $209,407 | |
| Previous Owner | Reese William Norwood | $163,400 | |
| Previous Owner | Reese William N | $203,250 |
Source: Public Records
Tax History Compared to Growth
Tax History
| Year | Tax Paid | Tax Assessment Tax Assessment Total Assessment is a certain percentage of the fair market value that is determined by local assessors to be the total taxable value of land and additions on the property. | Land | Improvement |
|---|---|---|---|---|
| 2024 | $3,879 | $202,419 | $20,000 | $182,419 |
| 2023 | $3,108 | $202,419 | $20,000 | $182,419 |
| 2022 | $2,907 | $202,419 | $20,000 | $182,419 |
| 2021 | $2,869 | $202,419 | $20,000 | $182,419 |
| 2019 | $2,859 | $192,100 | $20,000 | $172,100 |
| 2018 | $2,835 | $192,100 | $20,000 | $172,100 |
| 2017 | $2,835 | $192,100 | $20,000 | $172,100 |
| 2016 | $2,865 | $204,200 | $20,000 | $184,200 |
| 2015 | $2,865 | $204,200 | $20,000 | $184,200 |
| 2014 | $2,865 | $204,200 | $20,000 | $184,200 |
Source: Public Records
Map
Nearby Homes
- 6208 Birchbrook Dr
- 5904 Genesis Ct
- 6314 Bretton Woods Dr
- 6145 Woodspring Dr
- 6108 Camden Rd
- 6036-6070 Camden Rd
- 2124 Sir Michael Dr
- 2134 Queen Elizabeth Ln
- 3848 Oak Haven Rd
- 6628 Camden Rd
- 5917 Sunday Dr
- 5948 Lexington Dr
- 5929 Spinner Rd
- 3735 Harrisburg Dr
- 5909 Spinner Rd
- 5019 Woodspring Dr
- 5937 Spinner Rd
- 3558 Sturbridge Dr
- 3551 Sturbridge Dr
- 3555 Sturbridge Dr
- 3547 Sturbridge Dr
- 3201 Tully Ln
- 3200 Tully Ln
- 3559 Sturbridge Dr
- 3541 Sturbridge Dr
- 3862 Sturbridge Dr
- 3205 Tully Ln
- 3204 Tully Ln
- 3858 Sturbridge Dr
- 3535 Sturbridge Dr
- 3854 Sturbridge Dr
- 3556 Ravenswood Place
- 3600 Sturbridge Dr
- 3600 Sturbridge Dr
- 3850 Sturbridge Dr
- 3208 Tully Ln
- 3209 Tully Ln