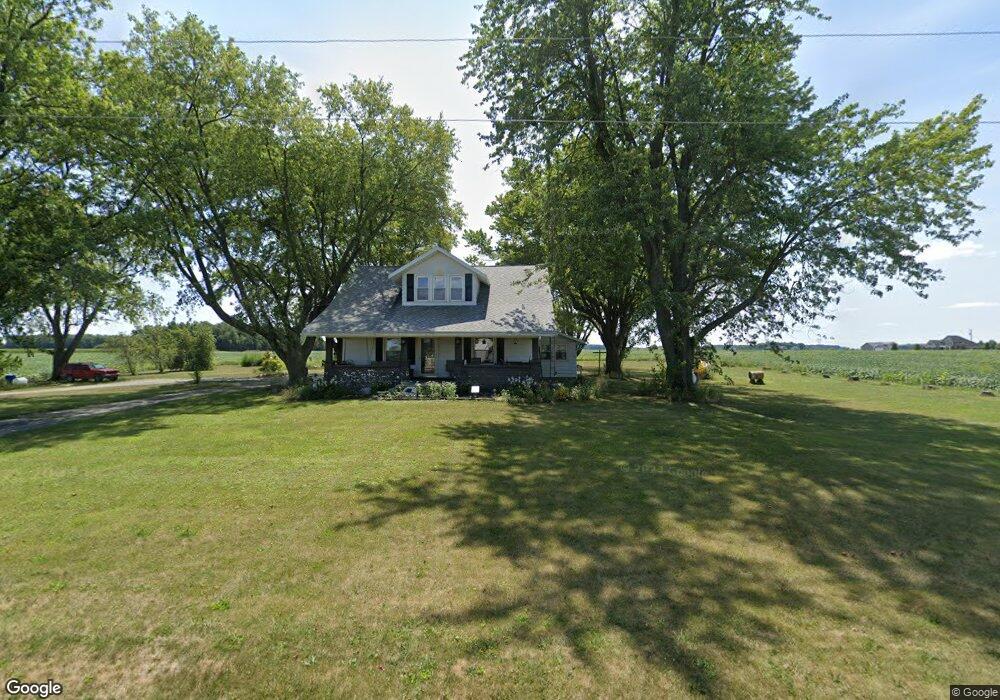
3558 Tama Rd Rockford, OH 45882
Estimated Value: $211,000 - $253,000
4
Beds
2
Baths
1,766
Sq Ft
$132/Sq Ft
Est. Value
About This Home
This home is located at 3558 Tama Rd, Rockford, OH 45882 and is currently estimated at $233,444, approximately $132 per square foot. 3558 Tama Rd is a home located in Mercer County with nearby schools including Parkway Elementary School, Parkway Middle School, and Parkway High School.
Ownership History
Date
Name
Owned For
Owner Type
Purchase Details
Closed on
May 22, 2009
Sold by
Debruijn Antionetta and Debruijn Hubertus
Bought by
Winters Ii John D and Winters Marie
Current Estimated Value
Home Financials for this Owner
Home Financials are based on the most recent Mortgage that was taken out on this home.
Original Mortgage
$82,000
Outstanding Balance
$21,601
Interest Rate
4.92%
Mortgage Type
Purchase Money Mortgage
Estimated Equity
$211,843
Purchase Details
Closed on
May 16, 2008
Sold by
Debruijn Hubertus M J and Debuijin Hubertus
Bought by
Debruijn Annette and Debruijn Antonietta
Purchase Details
Closed on
Mar 1, 2005
Sold by
Burger Mark A and Burger Laura A
Bought by
Debruijn Hubergus M J and Debruijn Annette
Home Financials for this Owner
Home Financials are based on the most recent Mortgage that was taken out on this home.
Original Mortgage
$82,000
Interest Rate
5.62%
Mortgage Type
Adjustable Rate Mortgage/ARM
Create a Home Valuation Report for This Property
The Home Valuation Report is an in-depth analysis detailing your home's value as well as a comparison with similar homes in the area
Home Values in the Area
Average Home Value in this Area
Purchase History
| Date | Buyer | Sale Price | Title Company |
|---|---|---|---|
| Winters Ii John D | $105,000 | Attorney | |
| Debruijn Annette | $109,400 | Attorney | |
| Debruijn Hubergus M J | $28,714 | None Available |
Source: Public Records
Mortgage History
| Date | Status | Borrower | Loan Amount |
|---|---|---|---|
| Open | Winters Ii John D | $82,000 | |
| Previous Owner | Debruijn Hubergus M J | $82,000 |
Source: Public Records
Tax History Compared to Growth
Tax History
| Year | Tax Paid | Tax Assessment Tax Assessment Total Assessment is a certain percentage of the fair market value that is determined by local assessors to be the total taxable value of land and additions on the property. | Land | Improvement |
|---|---|---|---|---|
| 2024 | $2,384 | $69,550 | $8,860 | $60,690 |
| 2023 | $2,384 | $69,550 | $8,860 | $60,690 |
| 2022 | $1,955 | $45,640 | $7,350 | $38,290 |
| 2021 | $1,943 | $45,640 | $7,350 | $38,290 |
| 2020 | $988 | $45,640 | $7,350 | $38,290 |
| 2019 | $1,457 | $35,490 | $7,000 | $28,490 |
| 2018 | $1,423 | $35,490 | $7,000 | $28,490 |
| 2017 | $1,323 | $35,490 | $7,000 | $28,490 |
| 2016 | $1,222 | $32,800 | $6,480 | $26,320 |
| 2015 | $1,210 | $32,800 | $6,480 | $26,320 |
| 2014 | $1,157 | $32,800 | $6,480 | $26,320 |
| 2013 | $1,281 | $32,800 | $6,480 | $26,320 |
Source: Public Records
Map
Nearby Homes
- 0 Wilson Unit 1037059
- 0 Wilson Unit 306333
- 11164 Erastus Durbin Rd
- 208 W Pearl St
- 0 Rockford West Rd Unit Lots 14- 28
- 208 Market St
- 7957 W Bridge St
- 9155 Us Route 127
- 6699 Gause Rd
- 1101 Timothy Ln
- 1218 Brittany Dr
- 1528 Mary Ln
- 4640 Sierra Dr
- 6764 Silver Lakes Dr
- 2332 State Route 29
- 0 Anderson 13&14 & Roadway 12&13 Unit 1037886
- 628 Hoying St
- 541 Lisle St
- 0 Anderson Lots 10 11 & 12 Ln Unit 1037885
- 0 Springer 1-6 & Roadway 14-16 Unit 1037883