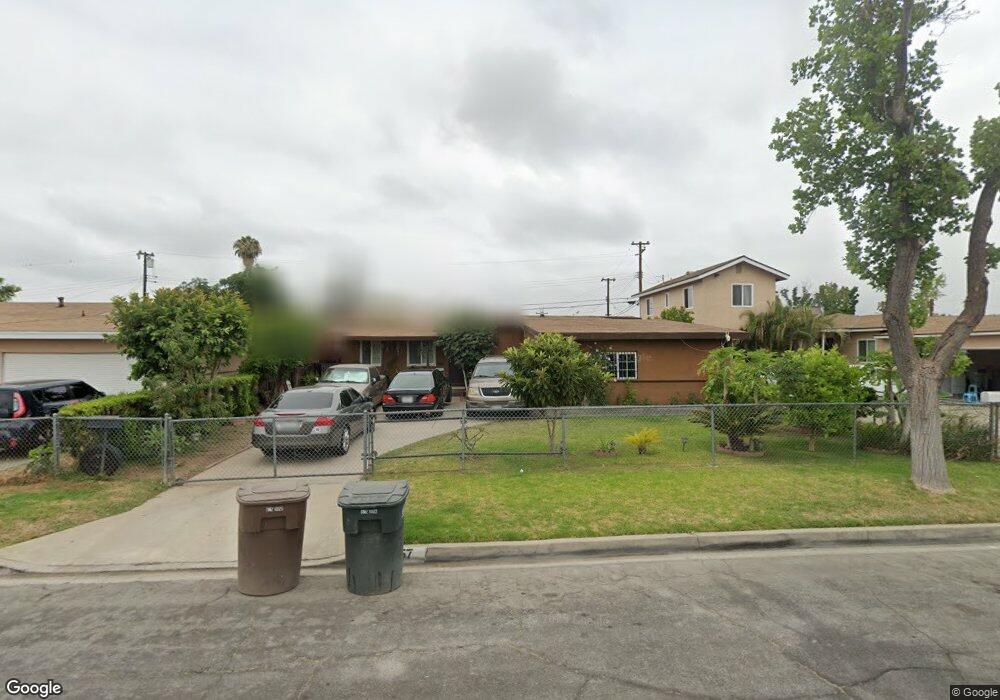
357 Maypop Ave La Puente, CA 91744
Estimated Value: $634,035 - $741,000
4
Beds
2
Baths
1,219
Sq Ft
$577/Sq Ft
Est. Value
About This Home
This home is located at 357 Maypop Ave, La Puente, CA 91744 and is currently estimated at $703,259, approximately $576 per square foot. 357 Maypop Ave is a home located in Los Angeles County with nearby schools including Nelson Elementary School, Sparks Middle School, and La Puente High School.
Ownership History
Date
Name
Owned For
Owner Type
Purchase Details
Closed on
Mar 23, 2015
Sold by
Marron Miguel
Bought by
Marron Miguel and Marron Dolores
Current Estimated Value
Home Financials for this Owner
Home Financials are based on the most recent Mortgage that was taken out on this home.
Original Mortgage
$139,000
Outstanding Balance
$106,342
Interest Rate
3.65%
Mortgage Type
New Conventional
Estimated Equity
$596,917
Purchase Details
Closed on
Oct 11, 2000
Sold by
Marron Dolores
Bought by
Marron Miguel
Home Financials for this Owner
Home Financials are based on the most recent Mortgage that was taken out on this home.
Original Mortgage
$161,667
Interest Rate
7.9%
Mortgage Type
FHA
Purchase Details
Closed on
Sep 25, 2000
Sold by
Corral Raul A
Bought by
Marron Miguel
Home Financials for this Owner
Home Financials are based on the most recent Mortgage that was taken out on this home.
Original Mortgage
$161,667
Interest Rate
7.9%
Mortgage Type
FHA
Create a Home Valuation Report for This Property
The Home Valuation Report is an in-depth analysis detailing your home's value as well as a comparison with similar homes in the area
Home Values in the Area
Average Home Value in this Area
Purchase History
| Date | Buyer | Sale Price | Title Company |
|---|---|---|---|
| Marron Miguel | -- | Fidelity National Title | |
| Marron Miguel | -- | Fidelity Title | |
| Marron Miguel | $163,000 | Fidelity Title |
Source: Public Records
Mortgage History
| Date | Status | Borrower | Loan Amount |
|---|---|---|---|
| Open | Marron Miguel | $139,000 | |
| Closed | Marron Miguel | $161,667 | |
| Closed | Marron Miguel | $4,703 |
Source: Public Records
Tax History Compared to Growth
Tax History
| Year | Tax Paid | Tax Assessment Tax Assessment Total Assessment is a certain percentage of the fair market value that is determined by local assessors to be the total taxable value of land and additions on the property. | Land | Improvement |
|---|---|---|---|---|
| 2025 | $3,308 | $245,596 | $143,593 | $102,003 |
| 2024 | $3,308 | $240,781 | $140,778 | $100,003 |
| 2023 | $3,226 | $236,061 | $138,018 | $98,043 |
| 2022 | $3,136 | $231,433 | $135,312 | $96,121 |
| 2021 | $3,078 | $226,896 | $132,659 | $94,237 |
| 2019 | $2,993 | $220,168 | $128,725 | $91,443 |
| 2018 | $2,853 | $215,851 | $126,201 | $89,650 |
| 2016 | $2,647 | $207,471 | $121,301 | $86,170 |
| 2015 | $2,598 | $204,355 | $119,479 | $84,876 |
| 2014 | $2,562 | $200,353 | $117,139 | $83,214 |
Source: Public Records
Map
Nearby Homes
- 15246 Temple Ave
- 15416 Giordano St
- 357 Cadbrook Dr
- 15732 Victoria Ave
- 14940 Beckner St
- 545 N 5th St
- 15900 Rowland St
- 14972 Giordano St
- 15879 Hill St
- 15625 Loukelton St
- 829 Foxworth Ave
- 750 Glenshaw Dr
- 665 Larimore Ave
- 822 Greenberry Dr
- 826 Del Valle Ave
- 16115 Central Ave
- 14612 Hutchcroft St
- 16142 Abbey St
- 16149 Abbey St
- 16322 Main St
- 351 Maypop Ave
- 363 Maypop Ave
- 345 Maypop Ave
- 369 Maypop Ave
- 15366 Moccasin St
- 15403 Las Vecinas Dr
- 15359 Las Vecinas Dr
- 15362 Las Vecinas Dr
- 339 Maypop Ave
- 15404 Moccasin St
- 15360 Moccasin St
- 15409 Las Vecinas Dr
- 15355 Las Vecinas Dr
- 15410 Moccasin St
- 15402 Las Vecinas Dr
- 15354 Moccasin St
- 335 Maypop Ave
- 15358 Las Vecinas Dr
- 15413 Las Vecinas Dr
- 15377 Moccasin St