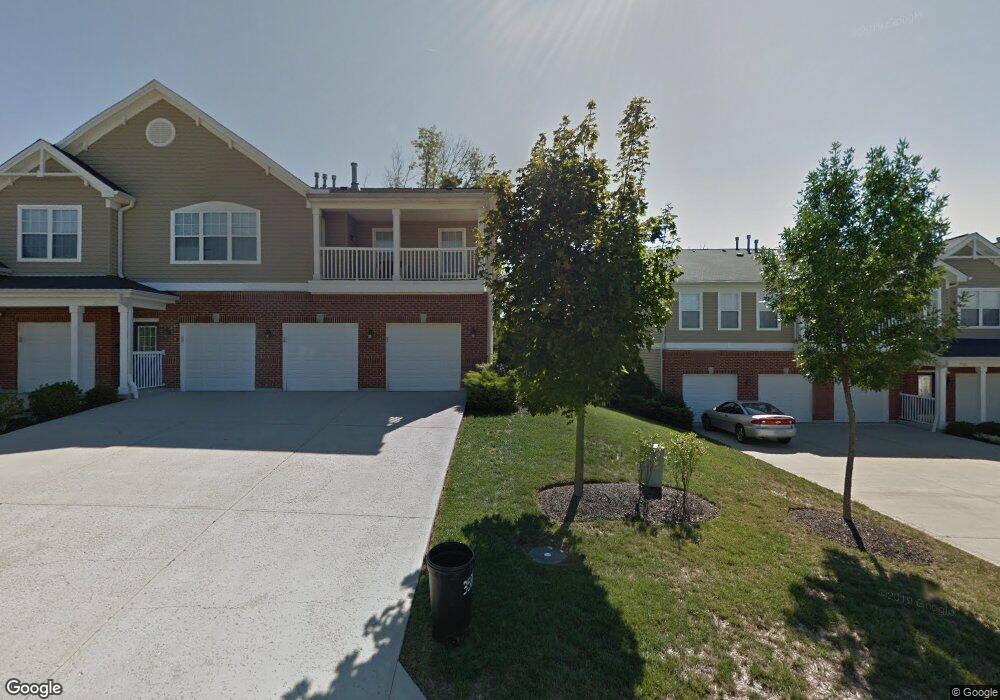
3570 Chestnut Park Ln Cleves, OH 45002
Estimated Value: $208,746 - $222,000
2
Beds
2
Baths
1,256
Sq Ft
$172/Sq Ft
Est. Value
About This Home
This home is located at 3570 Chestnut Park Ln, Cleves, OH 45002 and is currently estimated at $215,687, approximately $171 per square foot. 3570 Chestnut Park Ln is a home located in Hamilton County with nearby schools including Charles T. Young Elementary School, Taylor Middle School, and Taylor High School.
Ownership History
Date
Name
Owned For
Owner Type
Purchase Details
Closed on
May 19, 2015
Sold by
Indrias Meba
Bought by
Huffman Barbara A
Current Estimated Value
Purchase Details
Closed on
Sep 24, 2008
Sold by
Sauerbeck Scott and Sauerbeck Carly
Bought by
Indrias Meba
Home Financials for this Owner
Home Financials are based on the most recent Mortgage that was taken out on this home.
Original Mortgage
$96,400
Interest Rate
5.94%
Mortgage Type
Unknown
Purchase Details
Closed on
Jun 6, 2005
Sold by
Tdggc Llc
Bought by
Sauerbeck Scott and Sauerbeck Carly
Home Financials for this Owner
Home Financials are based on the most recent Mortgage that was taken out on this home.
Original Mortgage
$121,200
Interest Rate
5.25%
Mortgage Type
Fannie Mae Freddie Mac
Create a Home Valuation Report for This Property
The Home Valuation Report is an in-depth analysis detailing your home's value as well as a comparison with similar homes in the area
Home Values in the Area
Average Home Value in this Area
Purchase History
| Date | Buyer | Sale Price | Title Company |
|---|---|---|---|
| Huffman Barbara A | $113,000 | Attorney | |
| Indrias Meba | $120,500 | Attorney | |
| Sauerbeck Scott | -- | First Title Agency Inc |
Source: Public Records
Mortgage History
| Date | Status | Borrower | Loan Amount |
|---|---|---|---|
| Previous Owner | Indrias Meba | $96,400 | |
| Previous Owner | Sauerbeck Scott | $121,200 |
Source: Public Records
Tax History Compared to Growth
Tax History
| Year | Tax Paid | Tax Assessment Tax Assessment Total Assessment is a certain percentage of the fair market value that is determined by local assessors to be the total taxable value of land and additions on the property. | Land | Improvement |
|---|---|---|---|---|
| 2024 | $2,684 | $57,432 | $7,875 | $49,557 |
| 2023 | $2,685 | $57,432 | $7,875 | $49,557 |
| 2022 | $2,694 | $45,087 | $6,146 | $38,941 |
| 2021 | $2,624 | $45,087 | $6,146 | $38,941 |
| 2020 | $2,646 | $45,087 | $6,146 | $38,941 |
| 2019 | $2,508 | $39,550 | $5,390 | $34,160 |
| 2018 | $2,411 | $39,550 | $5,390 | $34,160 |
| 2017 | $2,262 | $39,550 | $5,390 | $34,160 |
| 2016 | $1,829 | $32,897 | $5,460 | $27,437 |
| 2015 | $1,846 | $32,897 | $5,460 | $27,437 |
| 2014 | $1,866 | $32,897 | $5,460 | $27,437 |
| 2013 | $2,340 | $42,175 | $7,000 | $35,175 |
Source: Public Records
Map
Nearby Homes
- 3600 Chestnut Park Ln
- 3594 Chestnut Park Ln
- 3596 Chestnut Park Ln
- 3503 Chestnut Park Ln
- 3498 Chestnut Park Ln
- 3693 Chestnut Park Ln
- 3736 Bremen Pass
- 3813 Beacon Woods Dr
- 3601 Chadwell Springs Ct
- 3829 Legendary Ridge Ln
- 3894 Bremen Pass
- 3830 Nottingham Ct
- 8735 Bridgetown Rd
- 7957 Rio Grande Dr
- 505 Aston View Ln
- 525 E State Rd
- 8708 Quietwood Ln
- 3615 Rio Bravo Trail
- 517 E State Rd
- 3876 Bear Ln
- 3586 Chestnut Park Ln
- 3572 Chestnut Park Ln
- 3552 Chestnut Park
- 3552 Chestnut Park Unit LANE
- 3554 Chestnut Park Unit 73
- 3554 Chestnut Park Unit LANE
- 3548 Chestnut Park Unit 711
- 3556 Chestnut Park
- 3556 Chestnut Park Unit LANE
- 3558 Chestnut Park
- 3560 Chestnut Park
- 3574 Chestnut Park Unit 62
- 3588 Chestnut Park Unit 69
- 3582 Chestnut Park
- 3570 Chestnut Park
- 3580 Chestnut Park
- 3582 Chestnut Park Unit LANE
- 3580 Chestnut Park Unit LANE
- 3570 Chestnut Park Unit LANE
- 3576 Chestnut Park Ln