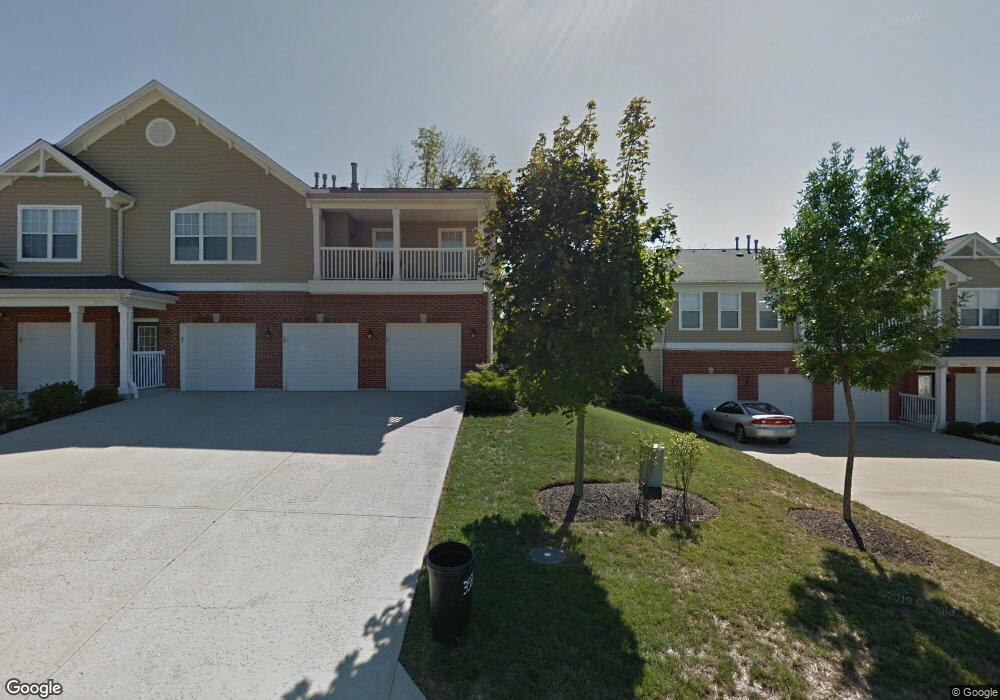
3580 Chestnut Park Cleves, OH 45002
Estimated Value: $191,000 - $214,000
2
Beds
2
Baths
1,224
Sq Ft
$169/Sq Ft
Est. Value
About This Home
This home is located at 3580 Chestnut Park, Cleves, OH 45002 and is currently estimated at $206,581, approximately $168 per square foot. 3580 Chestnut Park is a home located in Hamilton County with nearby schools including Charles T. Young Elementary School, Taylor Middle School, and Taylor High School.
Ownership History
Date
Name
Owned For
Owner Type
Purchase Details
Closed on
Apr 12, 2023
Sold by
Rebholz Family Trust
Bought by
Sabato Mary Teresa
Current Estimated Value
Purchase Details
Closed on
Jun 12, 2018
Sold by
Bergeron Herve and Bergeron Viola
Bought by
Rebholz Paul R and Rebholz Family Trust
Purchase Details
Closed on
Jul 1, 2013
Sold by
Voss Jackie J
Bought by
Bergeron Viola and Bergeron Herve
Purchase Details
Closed on
Sep 24, 2010
Sold by
Massa Donald A and Massa Florence V
Bought by
Voss Jackie J
Home Financials for this Owner
Home Financials are based on the most recent Mortgage that was taken out on this home.
Original Mortgage
$96,000
Interest Rate
4.26%
Mortgage Type
New Conventional
Purchase Details
Closed on
Sep 7, 2004
Sold by
Tdggc Llc
Bought by
Massa Donald A and Massa Florence
Create a Home Valuation Report for This Property
The Home Valuation Report is an in-depth analysis detailing your home's value as well as a comparison with similar homes in the area
Home Values in the Area
Average Home Value in this Area
Purchase History
| Date | Buyer | Sale Price | Title Company |
|---|---|---|---|
| Sabato Mary Teresa | $185,000 | None Listed On Document | |
| Sabato Mary Teresa | $185,000 | None Listed On Document | |
| Rebholz Paul R | $115,000 | None Available | |
| Bergeron Viola | $98,000 | Attorney | |
| Voss Jackie J | $120,000 | Stewart Title Company | |
| Massa Donald A | $139,900 | -- |
Source: Public Records
Mortgage History
| Date | Status | Borrower | Loan Amount |
|---|---|---|---|
| Previous Owner | Voss Jackie J | $96,000 |
Source: Public Records
Tax History Compared to Growth
Tax History
| Year | Tax Paid | Tax Assessment Tax Assessment Total Assessment is a certain percentage of the fair market value that is determined by local assessors to be the total taxable value of land and additions on the property. | Land | Improvement |
|---|---|---|---|---|
| 2024 | $2,659 | $56,903 | $7,875 | $49,028 |
| 2023 | $2,227 | $56,903 | $7,875 | $49,028 |
| 2022 | $1,879 | $40,250 | $6,146 | $34,104 |
| 2021 | $1,820 | $40,250 | $6,146 | $34,104 |
| 2020 | $1,848 | $40,250 | $6,146 | $34,104 |
| 2019 | $1,639 | $34,636 | $5,390 | $29,246 |
| 2018 | $1,576 | $34,636 | $5,390 | $29,246 |
| 2017 | $1,472 | $34,636 | $5,390 | $29,246 |
| 2016 | $1,404 | $34,300 | $5,460 | $28,840 |
| 2015 | $1,425 | $34,300 | $5,460 | $28,840 |
| 2014 | $1,441 | $34,300 | $5,460 | $28,840 |
| 2013 | $2,329 | $42,000 | $7,000 | $35,000 |
Source: Public Records
Map
Nearby Homes
- 3600 Chestnut Park Ln
- 3594 Chestnut Park Ln
- 3596 Chestnut Park Ln
- 3503 Chestnut Park Ln
- 3693 Chestnut Park Ln
- 3498 Chestnut Park Ln
- 3736 Bremen Pass
- 3813 Beacon Woods Dr
- 3601 Chadwell Springs Ct
- 3829 Legendary Ridge Ln
- 3894 Bremen Pass
- 3830 Nottingham Ct
- 8735 Bridgetown Rd
- 7957 Rio Grande Dr
- 505 Aston View Ln
- 525 E State Rd
- 8708 Quietwood Ln
- 3615 Rio Bravo Trail
- 517 E State Rd
- 3876 Bear Ln
- 3574 Chestnut Park Unit 62
- 3588 Chestnut Park Unit 69
- 3582 Chestnut Park
- 3570 Chestnut Park
- 3582 Chestnut Park Unit LANE
- 3580 Chestnut Park Unit LANE
- 3570 Chestnut Park Unit LANE
- 3576 Chestnut Park Ln
- 3574 Chestnut Park Ln Unit 6-2
- 3588 Chestnut Park Ln
- 3574 Chestnut Park Ln
- 3590 Chestnut Park Ln
- 3566 Chestnut Park Unit 79
- 3560 Chestnut Park
- 3558 Chestnut Park
- 3572 Chestnut Park
- 3572 Chestnut Park Unit LANE
- 3556 Chestnut Park
- 3556 Chestnut Park Unit LANE
- 3576 Chestnut Park Unit 3