36 Allen St Greenville, SC 29605
Dunean NeighborhoodEstimated Value: $200,564 - $302,000
3
Beds
1
Bath
1,496
Sq Ft
$159/Sq Ft
Est. Value
About This Home
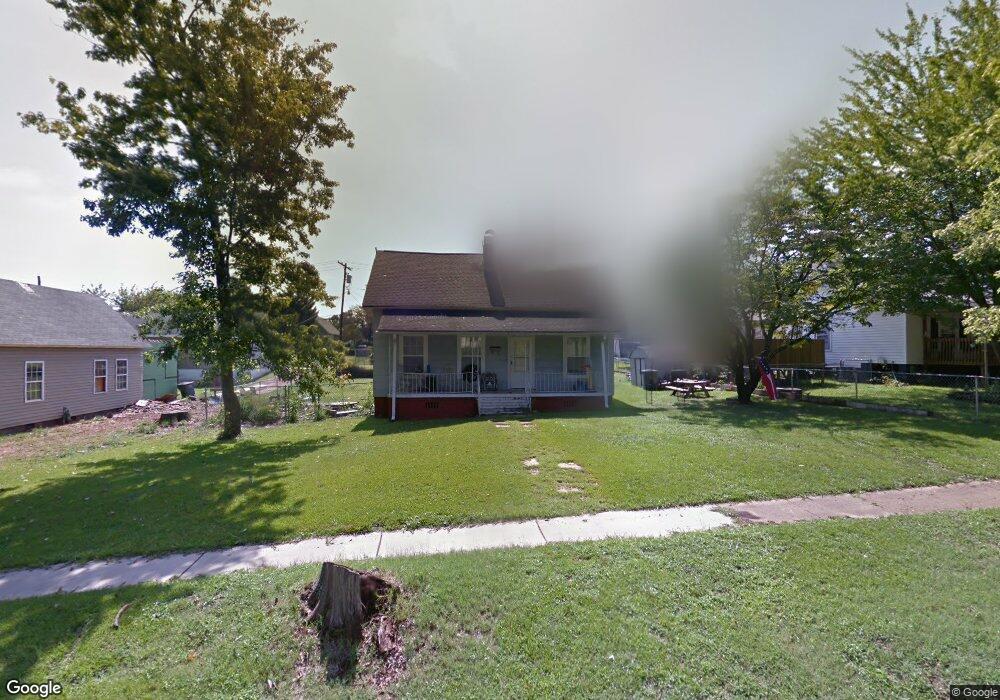
This home is located at 36 Allen St, Greenville, SC 29605 and is currently estimated at $238,391, approximately $159 per square foot. 36 Allen St is a home located in Greenville County with nearby schools including Thomas E. Kerns Elementary School, Hughes Academy of Science & Technology, and Southside High School.
Ownership History
Date
Name
Owned For
Owner Type
Purchase Details
Closed on
Oct 23, 2007
Sold by
Mckinney James T and Mckinney Sharon H
Bought by
A C B Investments Iii Llc
Current Estimated Value
Home Financials for this Owner
Home Financials are based on the most recent Mortgage that was taken out on this home.
Original Mortgage
$60,000
Outstanding Balance
$37,554
Interest Rate
6.26%
Mortgage Type
Commercial
Estimated Equity
$200,837
Create a Home Valuation Report for This Property
The Home Valuation Report is an in-depth analysis detailing your home's value as well as a comparison with similar homes in the area
Home Values in the Area
Average Home Value in this Area
Purchase History
| Date | Buyer | Sale Price | Title Company |
|---|---|---|---|
| A C B Investments Iii Llc | $54,500 | None Available |
Source: Public Records
Mortgage History
| Date | Status | Borrower | Loan Amount |
|---|---|---|---|
| Open | A C B Investments Iii Llc | $60,000 |
Source: Public Records
Tax History Compared to Growth
Tax History
| Year | Tax Paid | Tax Assessment Tax Assessment Total Assessment is a certain percentage of the fair market value that is determined by local assessors to be the total taxable value of land and additions on the property. | Land | Improvement |
|---|---|---|---|---|
| 2024 | $1,472 | $3,210 | $530 | $2,680 |
| 2023 | $1,472 | $3,210 | $530 | $2,680 |
| 2022 | $1,423 | $3,210 | $530 | $2,680 |
| 2021 | $1,529 | $3,210 | $530 | $2,680 |
| 2020 | $1,440 | $2,790 | $190 | $2,600 |
| 2019 | $1,419 | $2,790 | $190 | $2,600 |
| 2018 | $1,295 | $2,790 | $190 | $2,600 |
| 2017 | $1,295 | $2,790 | $190 | $2,600 |
| 2016 | $1,241 | $46,500 | $3,150 | $43,350 |
| 2015 | $1,241 | $46,500 | $3,150 | $43,350 |
| 2014 | $1,379 | $53,510 | $9,000 | $44,510 |
Source: Public Records
Map
Nearby Homes