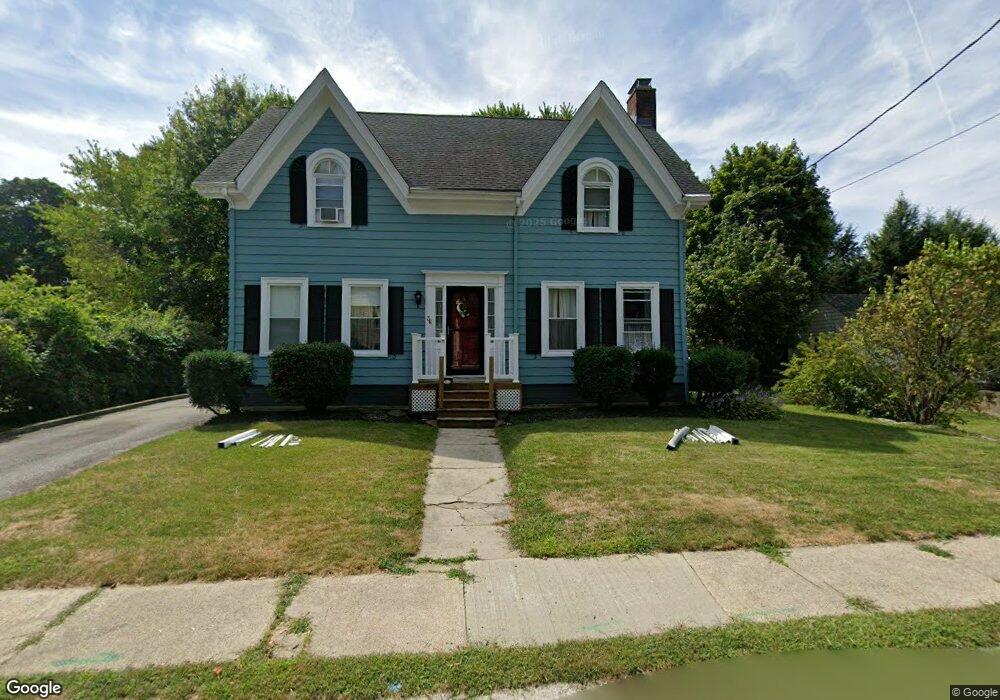
36 Ash St North Attleboro, MA 02760
North Attleboro NeighborhoodEstimated Value: $559,983 - $604,000
4
Beds
2
Baths
1,944
Sq Ft
$298/Sq Ft
Est. Value
About This Home
This home is located at 36 Ash St, North Attleboro, MA 02760 and is currently estimated at $580,246, approximately $298 per square foot. 36 Ash St is a home located in Bristol County with nearby schools including North Attleboro High School, Cadence Academy Preschool - North Attleborough, and Bishop Feehan High School.
Ownership History
Date
Name
Owned For
Owner Type
Purchase Details
Closed on
Jul 18, 2006
Sold by
Chapman Steven L and Iacono Krista M
Bought by
Galligan Elizabeth A and Galligan Thomas M
Current Estimated Value
Home Financials for this Owner
Home Financials are based on the most recent Mortgage that was taken out on this home.
Original Mortgage
$292,400
Interest Rate
6.71%
Mortgage Type
Purchase Money Mortgage
Purchase Details
Closed on
Feb 2, 2001
Sold by
Newbury Candace
Bought by
Chapman Steven L and Iacono Krista M
Purchase Details
Closed on
Feb 6, 1991
Sold by
Wall Richard B
Bought by
Newberry Candace
Create a Home Valuation Report for This Property
The Home Valuation Report is an in-depth analysis detailing your home's value as well as a comparison with similar homes in the area
Home Values in the Area
Average Home Value in this Area
Purchase History
| Date | Buyer | Sale Price | Title Company |
|---|---|---|---|
| Galligan Elizabeth A | $365,500 | -- | |
| Chapman Steven L | $220,000 | -- | |
| Newberry Candace | $150,000 | -- |
Source: Public Records
Mortgage History
| Date | Status | Borrower | Loan Amount |
|---|---|---|---|
| Open | Newberry Candace | $275,400 | |
| Closed | Galligan Elizabeth A | $292,400 | |
| Previous Owner | Newberry Candace | $193,000 | |
| Previous Owner | Newberry Candace | $49,000 |
Source: Public Records
Tax History Compared to Growth
Tax History
| Year | Tax Paid | Tax Assessment Tax Assessment Total Assessment is a certain percentage of the fair market value that is determined by local assessors to be the total taxable value of land and additions on the property. | Land | Improvement |
|---|---|---|---|---|
| 2025 | $5,919 | $502,000 | $145,000 | $357,000 |
| 2024 | $5,649 | $489,500 | $145,000 | $344,500 |
| 2023 | $5,684 | $444,400 | $151,300 | $293,100 |
| 2022 | $5,579 | $400,500 | $145,000 | $255,500 |
| 2021 | $9,340 | $366,200 | $145,000 | $221,200 |
| 2020 | $9,047 | $361,100 | $145,000 | $216,100 |
| 2019 | $8,791 | $339,300 | $131,800 | $207,500 |
| 2018 | $4,299 | $322,300 | $131,800 | $190,500 |
| 2017 | $8,767 | $305,300 | $131,800 | $173,500 |
| 2016 | $3,930 | $297,300 | $152,800 | $144,500 |
| 2015 | $3,766 | $286,600 | $159,200 | $127,400 |
| 2014 | $3,695 | $279,100 | $139,700 | $139,400 |
Source: Public Records
Map
Nearby Homes
- 80 Broadway Unit 9
- 50 Metcalf Rd
- 137 Sumner St
- 300 E Washington St Unit 54R
- 93 Bank St
- 130 E Washington St Unit 57
- 130 E Washington St Unit 71
- 130 E Washington St Unit 36
- 130 E Washington St Unit 9
- 160 Crescent Ave
- 16 Richards Ave Unit 106
- 40 Roosevelt Ave
- 12 Roosevelt Ave
- 16 Johnson St
- 19 Church St Unit C9
- 27 Taylor St
- 46 Westside Ave
- 0 Anawan Rd
- 30 Sperry Ln Unit Lot 15
- 121 E Washington St Unit 8