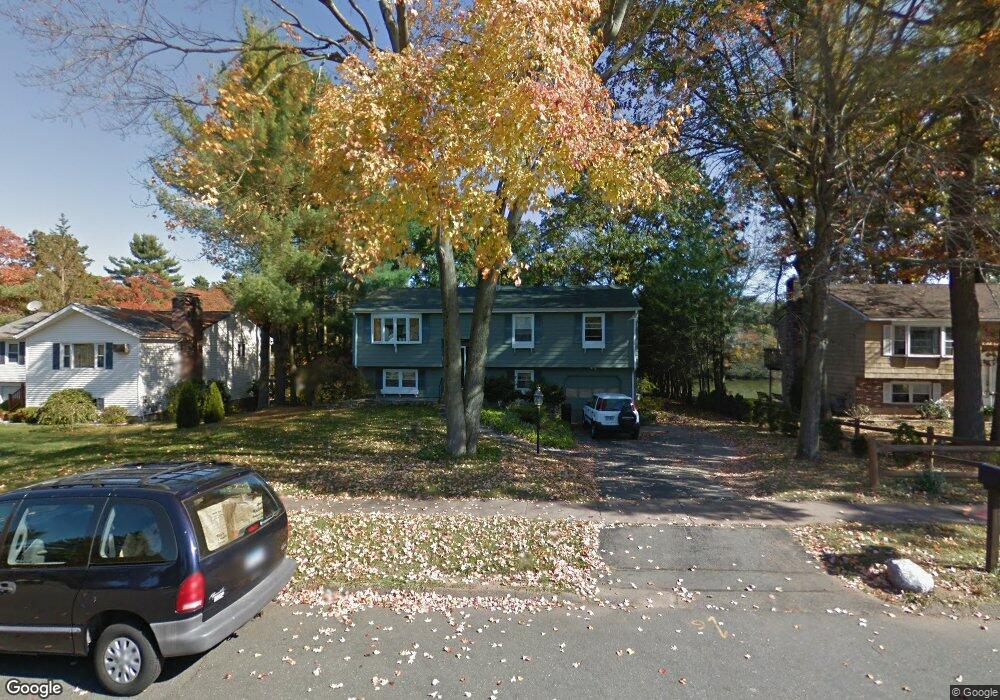
36 Cattail Rd Glastonbury, CT 06033
Addison NeighborhoodEstimated Value: $429,378 - $523,000
3
Beds
3
Baths
1,740
Sq Ft
$275/Sq Ft
Est. Value
About This Home
This home is located at 36 Cattail Rd, Glastonbury, CT 06033 and is currently estimated at $478,095, approximately $274 per square foot. 36 Cattail Rd is a home located in Hartford County with nearby schools including Naubuc School, Gideon Welles School, and Smith Middle School.
Ownership History
Date
Name
Owned For
Owner Type
Purchase Details
Closed on
Dec 27, 2018
Sold by
Kwiatkowski Dorothy
Bought by
Kwiatkowski Dorothy
Current Estimated Value
Purchase Details
Closed on
Feb 22, 2018
Sold by
Shields Frank G Est
Bought by
Kwiatkowski Dorothy
Purchase Details
Closed on
Jun 28, 2010
Sold by
Shields Frank and Kwiatkowski Dorothy
Bought by
Shields Frank and Kwiatkowski Dorothy
Purchase Details
Closed on
Nov 26, 2007
Sold by
Dconnor James D
Bought by
Shields Frank and Kwiatkowski Dorothy
Purchase Details
Closed on
Jun 15, 1998
Sold by
Emonds Michael J and Emonds Kerry F
Bought by
Conner James F O
Purchase Details
Closed on
Jun 30, 1992
Sold by
Lombardi Gianel N
Bought by
Emonds Michael J
Purchase Details
Closed on
Sep 4, 1991
Sold by
Lombardi Beverly J
Bought by
Lombardi Gianel N
Purchase Details
Closed on
Sep 21, 1990
Sold by
Higgins Norman
Bought by
Lombardi Beverly
Create a Home Valuation Report for This Property
The Home Valuation Report is an in-depth analysis detailing your home's value as well as a comparison with similar homes in the area
Home Values in the Area
Average Home Value in this Area
Purchase History
| Date | Buyer | Sale Price | Title Company |
|---|---|---|---|
| Kwiatkowski Dorothy | -- | -- | |
| Kwiatkowski Dorothy | -- | -- | |
| Shields Frank | -- | -- | |
| Shields Frank | $280,000 | -- | |
| Conner James F O | $154,000 | -- | |
| Emonds Michael J | $140,000 | -- | |
| Lombardi Gianel N | $150,000 | -- | |
| Lombardi Beverly | $160,000 | -- |
Source: Public Records
Mortgage History
| Date | Status | Borrower | Loan Amount |
|---|---|---|---|
| Previous Owner | Lombardi Beverly | $55,000 | |
| Previous Owner | Lombardi Beverly | $35,000 |
Source: Public Records
Tax History Compared to Growth
Tax History
| Year | Tax Paid | Tax Assessment Tax Assessment Total Assessment is a certain percentage of the fair market value that is determined by local assessors to be the total taxable value of land and additions on the property. | Land | Improvement |
|---|---|---|---|---|
| 2025 | $7,275 | $221,600 | $104,100 | $117,500 |
| 2024 | $7,076 | $221,600 | $104,100 | $117,500 |
| 2023 | $6,872 | $221,600 | $104,100 | $117,500 |
| 2022 | $7,065 | $189,400 | $86,700 | $102,700 |
| 2021 | $7,068 | $189,400 | $86,700 | $102,700 |
| 2020 | $6,989 | $189,400 | $86,700 | $102,700 |
| 2019 | $6,887 | $189,400 | $86,700 | $102,700 |
| 2018 | $6,818 | $189,400 | $86,700 | $102,700 |
| 2017 | $6,460 | $172,500 | $86,700 | $85,800 |
| 2016 | $6,279 | $172,500 | $86,700 | $85,800 |
| 2015 | $6,227 | $172,500 | $86,700 | $85,800 |
| 2014 | $5,551 | $155,700 | $86,700 | $69,000 |
Source: Public Records
Map
Nearby Homes
- 70 Green Manor Dr
- 33 April Dr
- 319 Great Swamp Rd
- 131 Country Ln
- 85 Oxbow Dr Unit C7
- 7 Cheney Ln
- 5 Garland Dr
- 8 Butternut Dr
- 17 Garland Dr
- 496 Hills St
- 13 Holly Ln Unit 13
- 19 Stonecress Ln
- 12 Addison Rd Unit 14
- 252 Woodmont Dr
- 3 Periwinkle Ln
- 45 Brookfield Dr
- 133 Shelley Ln
- 67 Kingston Dr
- 381 Oak St
- 62 Bramblebush Rd
- 42 Cattail Rd
- 28 Cattail Rd
- 52 Cattail Rd
- 33 Cattail Rd
- 41 Cattail Rd
- 23 Cattail Rd
- 47 Cattail Rd
- 75 Duck Pond Rd
- 29 Coltsfoot Cir
- 13 Cattail Rd
- 7 Coltsfoot Cir
- 81 Duck Pond Rd
- 17 Coltsfoot Cir
- 42 Coltsfoot Cir
- 3 Coltsfoot Cir
- 52 Coltsfoot Cir
- 36 Coltsfoot Cir
- 64 Duck Pond Rd
- 5 Cattail Rd
- 560 Addison Rd