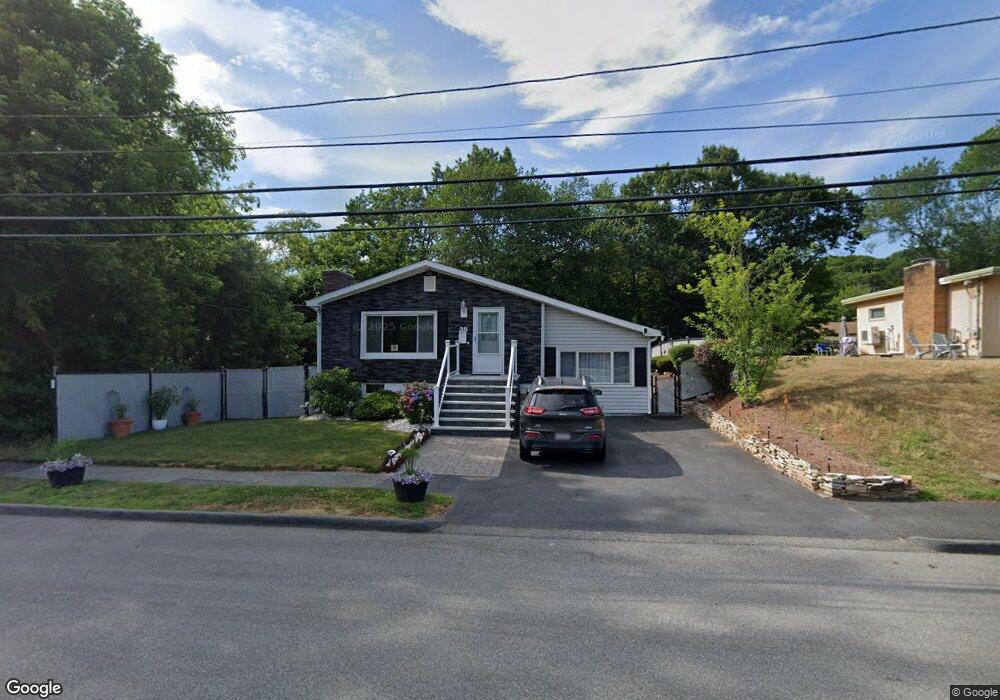
36 Hurd Ave Saugus, MA 01906
Downtown Saugus NeighborhoodEstimated Value: $633,000 - $759,000
2
Beds
2
Baths
1,164
Sq Ft
$582/Sq Ft
Est. Value
About This Home
This home is located at 36 Hurd Ave, Saugus, MA 01906 and is currently estimated at $676,948, approximately $581 per square foot. 36 Hurd Ave is a home located in Essex County with nearby schools including Saugus High School, Pioneer Charter School Of Science II, and Sacred Heart School.
Ownership History
Date
Name
Owned For
Owner Type
Purchase Details
Closed on
Dec 31, 2002
Sold by
Boyle Okeefe Christina A and Okeefe Edward J
Bought by
Vaugham Eric J and Vaughan Eric J
Current Estimated Value
Purchase Details
Closed on
Oct 26, 2000
Sold by
Johnson Richard and Johnson Marianne
Bought by
Boyle Christine A and Okeefe Edward J
Create a Home Valuation Report for This Property
The Home Valuation Report is an in-depth analysis detailing your home's value as well as a comparison with similar homes in the area
Home Values in the Area
Average Home Value in this Area
Purchase History
| Date | Buyer | Sale Price | Title Company |
|---|---|---|---|
| Vaugham Eric J | $316,000 | -- | |
| Boyle Christine A | $227,000 | -- |
Source: Public Records
Mortgage History
| Date | Status | Borrower | Loan Amount |
|---|---|---|---|
| Open | Boyle Christine A | $34,300 |
Source: Public Records
Tax History Compared to Growth
Tax History
| Year | Tax Paid | Tax Assessment Tax Assessment Total Assessment is a certain percentage of the fair market value that is determined by local assessors to be the total taxable value of land and additions on the property. | Land | Improvement |
|---|---|---|---|---|
| 2025 | $6,025 | $564,100 | $306,300 | $257,800 |
| 2024 | $5,763 | $541,100 | $288,800 | $252,300 |
| 2023 | $5,592 | $496,600 | $253,800 | $242,800 |
| 2022 | $5,317 | $442,700 | $232,800 | $209,900 |
| 2021 | $5,084 | $412,000 | $202,100 | $209,900 |
| 2020 | $4,700 | $394,300 | $192,500 | $201,800 |
| 2019 | $4,499 | $369,400 | $175,000 | $194,400 |
| 2018 | $4,117 | $355,500 | $169,800 | $185,700 |
| 2017 | $3,743 | $310,600 | $158,400 | $152,200 |
| 2016 | $3,697 | $303,000 | $158,100 | $144,900 |
| 2015 | $3,469 | $288,600 | $150,600 | $138,000 |
| 2014 | $3,287 | $283,100 | $150,600 | $132,500 |
Source: Public Records
Map
Nearby Homes