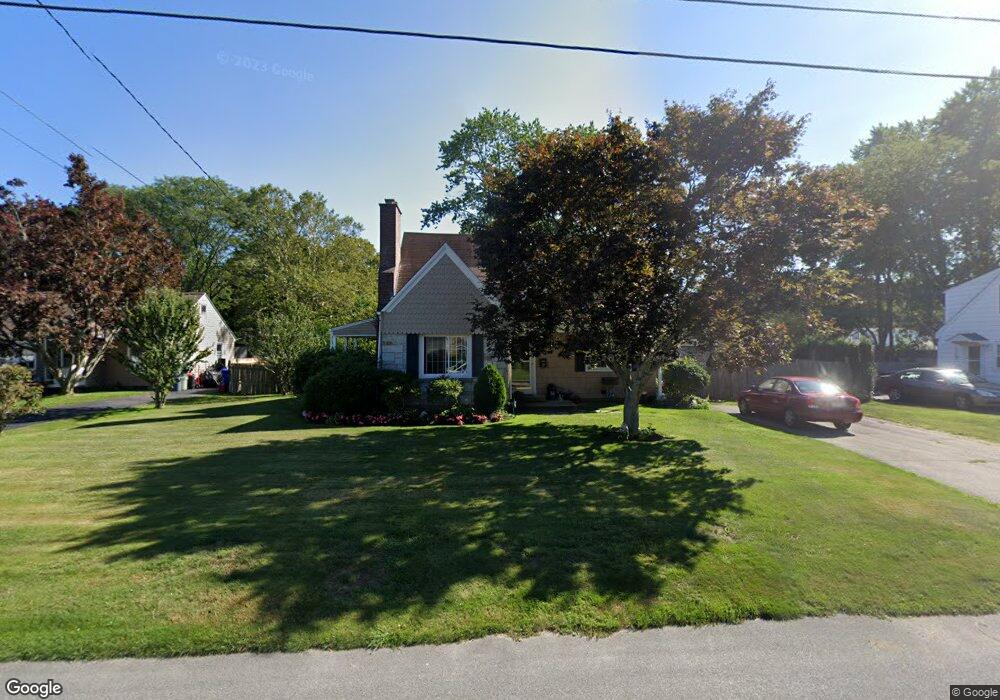
36 Lindy Ave Riverside, RI 02915
Riverside NeighborhoodEstimated Value: $436,000 - $496,071
3
Beds
2
Baths
1,516
Sq Ft
$308/Sq Ft
Est. Value
About This Home
This home is located at 36 Lindy Ave, Riverside, RI 02915 and is currently estimated at $466,768, approximately $307 per square foot. 36 Lindy Ave is a home located in Providence County with nearby schools including East Providence High School, St Luke Elementary School, and Barrington Christian Academy.
Ownership History
Date
Name
Owned For
Owner Type
Purchase Details
Closed on
Jul 16, 2009
Sold by
Us Bank Na
Bought by
Borges Lillian P
Current Estimated Value
Purchase Details
Closed on
Feb 20, 2009
Sold by
Martins Roberto C and Martins Beth A
Bought by
Us Bank Na
Purchase Details
Closed on
Jul 8, 2005
Sold by
Poisson Phyllis A
Bought by
Martins Roberto C and Martins Beth A
Create a Home Valuation Report for This Property
The Home Valuation Report is an in-depth analysis detailing your home's value as well as a comparison with similar homes in the area
Home Values in the Area
Average Home Value in this Area
Purchase History
| Date | Buyer | Sale Price | Title Company |
|---|---|---|---|
| Borges Lillian P | $130,000 | -- | |
| Us Bank Na | $138,000 | -- | |
| Martins Roberto C | $248,000 | -- |
Source: Public Records
Mortgage History
| Date | Status | Borrower | Loan Amount |
|---|---|---|---|
| Open | Martins Roberto C | $165,000 | |
| Closed | Martins Roberto C | $140,000 |
Source: Public Records
Tax History Compared to Growth
Tax History
| Year | Tax Paid | Tax Assessment Tax Assessment Total Assessment is a certain percentage of the fair market value that is determined by local assessors to be the total taxable value of land and additions on the property. | Land | Improvement |
|---|---|---|---|---|
| 2025 | $5,863 | $448,600 | $140,800 | $307,800 |
| 2024 | $5,916 | $385,900 | $117,300 | $268,600 |
| 2023 | $5,696 | $385,900 | $117,300 | $268,600 |
| 2022 | $5,439 | $248,800 | $63,900 | $184,900 |
| 2021 | $5,349 | $248,800 | $62,700 | $186,100 |
| 2020 | $5,123 | $248,800 | $62,700 | $186,100 |
| 2019 | $4,981 | $248,800 | $62,700 | $186,100 |
| 2018 | $4,631 | $202,400 | $61,200 | $141,200 |
| 2017 | $4,528 | $202,400 | $61,200 | $141,200 |
| 2016 | $4,505 | $202,400 | $61,200 | $141,200 |
| 2015 | $4,468 | $194,700 | $56,700 | $138,000 |
| 2014 | $4,468 | $194,700 | $56,700 | $138,000 |
Source: Public Records
Map
Nearby Homes