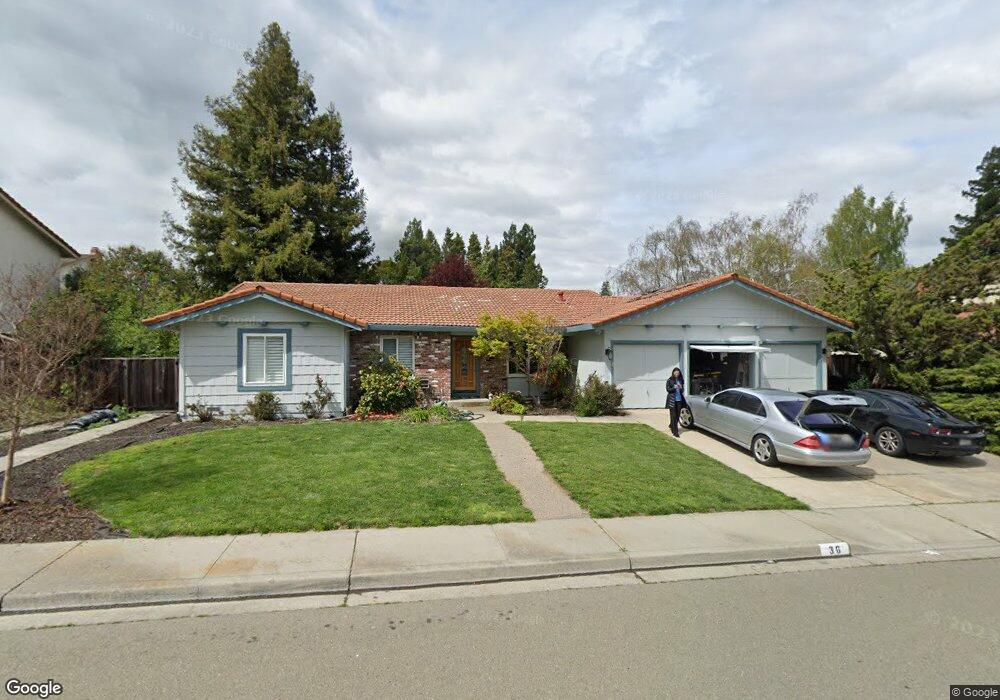
36 Mesa Vista Ct San Ramon, CA 94583
Twin Creeks NeighborhoodEstimated Value: $1,487,000 - $1,696,000
4
Beds
2
Baths
2,070
Sq Ft
$774/Sq Ft
Est. Value
About This Home
This home is located at 36 Mesa Vista Ct, San Ramon, CA 94583 and is currently estimated at $1,601,770, approximately $773 per square foot. 36 Mesa Vista Ct is a home located in Contra Costa County with nearby schools including Bollinger Canyon Elementary School, Iron Horse Middle School, and California High School.
Ownership History
Date
Name
Owned For
Owner Type
Purchase Details
Closed on
Feb 24, 1998
Sold by
Smart and Susan
Bought by
Smart Roy J and Smart Susan M
Current Estimated Value
Create a Home Valuation Report for This Property
The Home Valuation Report is an in-depth analysis detailing your home's value as well as a comparison with similar homes in the area
Home Values in the Area
Average Home Value in this Area
Purchase History
| Date | Buyer | Sale Price | Title Company |
|---|---|---|---|
| Smart Roy J | -- | -- |
Source: Public Records
Tax History Compared to Growth
Tax History
| Year | Tax Paid | Tax Assessment Tax Assessment Total Assessment is a certain percentage of the fair market value that is determined by local assessors to be the total taxable value of land and additions on the property. | Land | Improvement |
|---|---|---|---|---|
| 2025 | $6,612 | $532,111 | $346,328 | $185,783 |
| 2024 | $6,496 | $521,679 | $339,538 | $182,141 |
| 2023 | $6,496 | $511,451 | $332,881 | $178,570 |
| 2022 | $6,446 | $501,423 | $326,354 | $175,069 |
| 2021 | $6,301 | $491,592 | $319,955 | $171,637 |
| 2019 | $6,144 | $477,014 | $310,466 | $166,548 |
| 2018 | $5,915 | $467,662 | $304,379 | $163,283 |
| 2017 | $5,695 | $458,493 | $298,411 | $160,082 |
| 2016 | $5,608 | $449,504 | $292,560 | $156,944 |
| 2015 | $5,524 | $442,753 | $288,166 | $154,587 |
| 2014 | $5,436 | $434,081 | $282,522 | $151,559 |
Source: Public Records
Map
Nearby Homes
- 600 Guaymas Ct
- 2632 Campeche Ct
- 2720 Marsh Dr
- Plan 3 at City Village - The Courts
- Plan 3 at City Village - The Towns
- Plan 1 at City Village - The Courts
- Plan 1 at City Village - The Towns
- Plan 3X at City Village - The Courts
- Plan 1X at City Village - The Courts
- Plan 2 at City Village - The Towns
- Plan 1 at City Village - The Rows
- Plan 4 at City Village - The Towns
- Plan 2 at City Village - The Rows
- Plan 2 at City Village - The Courts
- Plan 3 at City Village - The Rows
- 2482 Wildhorse Dr
- 205 Compton Cir Unit B
- 560 La Copita Ct
- 44 Dos Rios Ct
- 321 Isabelline Ct
- 58 Mesa Vista Ct
- 44 Mesa Vista Ct
- 32 Mesa Vista Ct
- 39 Mesa Vista Ct
- 485 Santander Dr
- 35 Mesa Vista Ct
- 62 Mesa Vista Ct
- 43 Mesa Vista Ct
- 31 Mesa Vista Ct
- 491 Santander Dr
- 66 Mesa Vista Ct
- 19 Ferrol Ct
- 47 Mesa Vista Ct
- 59 Mesa Vista Ct
- 55 Mesa Vista Ct
- 68 Ayamonte Ct
- 70 Ayamonte Ct
- 64 Ayamonte Ct
- 66 Ayamonte Ct
- 51 Mesa Vista Ct