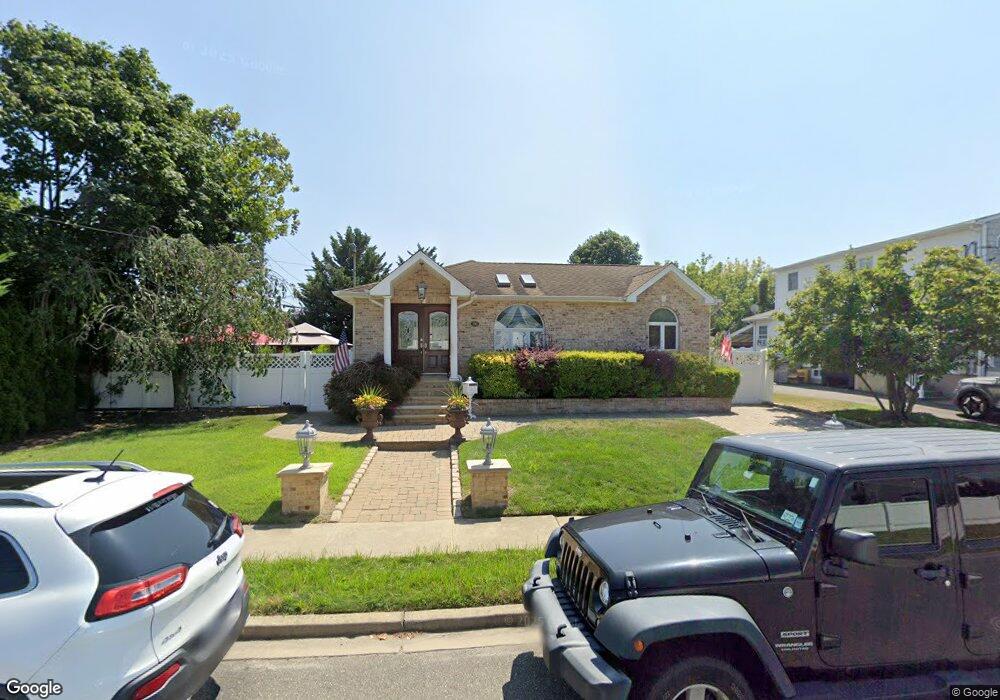
36 Orchard St Massapequa, NY 11758
Estimated Value: $620,752 - $698,000
--
Bed
2
Baths
1,272
Sq Ft
$518/Sq Ft
Est. Value
About This Home
This home is located at 36 Orchard St, Massapequa, NY 11758 and is currently estimated at $659,376, approximately $518 per square foot. 36 Orchard St is a home located in Nassau County with nearby schools including Massapequa High School - Ames Campus, Berner Middle School, and Massapequa High School.
Ownership History
Date
Name
Owned For
Owner Type
Purchase Details
Closed on
May 17, 2002
Sold by
Cicero Anthony
Bought by
Zisa Salvatore
Current Estimated Value
Purchase Details
Closed on
Aug 7, 2001
Purchase Details
Closed on
Jun 24, 1999
Sold by
Matzen Robert and Matzen Richard
Bought by
Genovese Antonio
Home Financials for this Owner
Home Financials are based on the most recent Mortgage that was taken out on this home.
Original Mortgage
$163,800
Interest Rate
7.19%
Purchase Details
Closed on
Sep 15, 1998
Create a Home Valuation Report for This Property
The Home Valuation Report is an in-depth analysis detailing your home's value as well as a comparison with similar homes in the area
Home Values in the Area
Average Home Value in this Area
Purchase History
| Date | Buyer | Sale Price | Title Company |
|---|---|---|---|
| Zisa Salvatore | $370,000 | -- | |
| -- | $325,000 | -- | |
| Genovese Antonio | $182,000 | First American Title Ins Co | |
| -- | -- | -- |
Source: Public Records
Mortgage History
| Date | Status | Borrower | Loan Amount |
|---|---|---|---|
| Previous Owner | Genovese Antonio | $163,800 |
Source: Public Records
Tax History Compared to Growth
Tax History
| Year | Tax Paid | Tax Assessment Tax Assessment Total Assessment is a certain percentage of the fair market value that is determined by local assessors to be the total taxable value of land and additions on the property. | Land | Improvement |
|---|---|---|---|---|
| 2025 | $11,093 | $423 | $185 | $238 |
| 2024 | $3,885 | $423 | $185 | $238 |
| 2023 | $11,849 | $423 | $185 | $238 |
| 2022 | $11,849 | $423 | $185 | $238 |
| 2021 | $12,755 | $407 | $178 | $229 |
| 2020 | $13,915 | $917 | $735 | $182 |
| 2019 | $14,976 | $917 | $735 | $182 |
| 2018 | $13,831 | $917 | $0 | $0 |
| 2017 | $7,683 | $917 | $735 | $182 |
| 2016 | $12,144 | $917 | $735 | $182 |
| 2015 | $4,004 | $917 | $735 | $182 |
| 2014 | $4,004 | $917 | $735 | $182 |
| 2013 | $3,641 | $917 | $735 | $182 |
Source: Public Records
Map
Nearby Homes
- 243 Seaford Ave
- 17 Linden St
- 230 W End Ave
- 54 Chestnut St
- 5675 Merrick Rd
- 3937 John Ln
- 138 Saint Marks Place
- 3945 Hickory St
- 344 Harrison Ave
- 3969 Marlow Ct
- 135 Ocean Ave
- 28 Grove St
- 94 Alhambra Rd
- 2067 Jackson Ave
- 4 Sutton Place
- 5 Canal Rd
- 3875 South St
- 3861 Hickory St
- 2327 Mattituck Ave
- 43 Seabreeze Rd