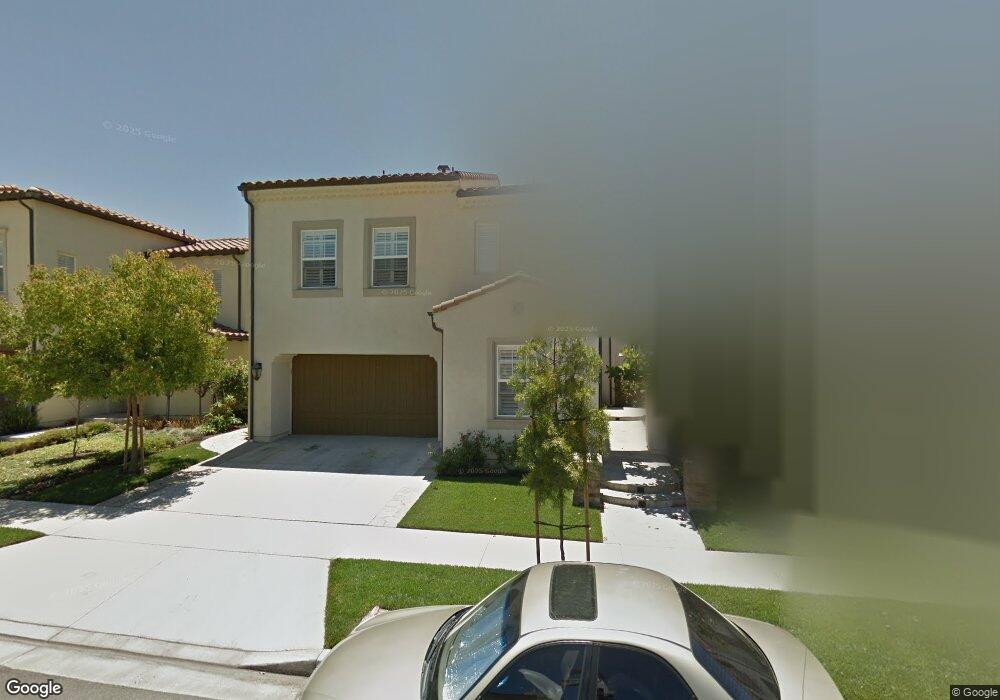
36 Waterspout Irvine, CA 92620
Woodbury and Stonegate NeighborhoodEstimated Value: $1,943,543 - $2,241,000
4
Beds
3
Baths
2,339
Sq Ft
$903/Sq Ft
Est. Value
About This Home
This home is located at 36 Waterspout, Irvine, CA 92620 and is currently estimated at $2,113,136, approximately $903 per square foot. 36 Waterspout is a home located in Orange County with nearby schools including Jeffrey Trail Middle, Portola High School, and New Horizon Elementary School.
Ownership History
Date
Name
Owned For
Owner Type
Purchase Details
Closed on
Jan 31, 2022
Sold by
Seok Suh Sang and Seok Kyung Hye
Bought by
Sub Sang Seok
Current Estimated Value
Home Financials for this Owner
Home Financials are based on the most recent Mortgage that was taken out on this home.
Original Mortgage
$791,000
Outstanding Balance
$727,066
Interest Rate
2.75%
Mortgage Type
New Conventional
Estimated Equity
$1,386,070
Purchase Details
Closed on
Aug 16, 2019
Sold by
Suh Sang Seok and Suh Hye Kyung
Bought by
Suh Sang Seok and Suh Hye Kyung
Home Financials for this Owner
Home Financials are based on the most recent Mortgage that was taken out on this home.
Original Mortgage
$791,000
Interest Rate
3.5%
Mortgage Type
Adjustable Rate Mortgage/ARM
Purchase Details
Closed on
Mar 12, 2012
Sold by
Suh Sang Seok and Suh Hye Kyung
Bought by
Suh Sang Seok and Suh Hye Kyung
Home Financials for this Owner
Home Financials are based on the most recent Mortgage that was taken out on this home.
Original Mortgage
$484,000
Interest Rate
3.12%
Mortgage Type
New Conventional
Purchase Details
Closed on
Feb 7, 2006
Sold by
California Pacific Homes Lp
Bought by
Suh Sang Seok and Suh Hye Kyung
Home Financials for this Owner
Home Financials are based on the most recent Mortgage that was taken out on this home.
Original Mortgage
$540,000
Interest Rate
5.62%
Mortgage Type
Purchase Money Mortgage
Create a Home Valuation Report for This Property
The Home Valuation Report is an in-depth analysis detailing your home's value as well as a comparison with similar homes in the area
Home Values in the Area
Average Home Value in this Area
Purchase History
| Date | Buyer | Sale Price | Title Company |
|---|---|---|---|
| Sub Sang Seok | -- | Provident Title | |
| Suh Sang Seok | -- | Westminister Title | |
| Suh Sang Seok | -- | First American Title | |
| Suh Sang Seok | $857,000 | Fidelity National Title-Buil |
Source: Public Records
Mortgage History
| Date | Status | Borrower | Loan Amount |
|---|---|---|---|
| Open | Sub Sang Seok | $791,000 | |
| Previous Owner | Suh Sang Seok | $791,000 | |
| Previous Owner | Suh Sang Seok | $484,000 | |
| Previous Owner | Suh Sang Seok | $540,000 |
Source: Public Records
Tax History Compared to Growth
Tax History
| Year | Tax Paid | Tax Assessment Tax Assessment Total Assessment is a certain percentage of the fair market value that is determined by local assessors to be the total taxable value of land and additions on the property. | Land | Improvement |
|---|---|---|---|---|
| 2025 | $15,411 | $1,171,155 | $677,982 | $493,173 |
| 2024 | $15,411 | $1,148,192 | $664,689 | $483,503 |
| 2023 | $15,097 | $1,125,679 | $651,656 | $474,023 |
| 2022 | $14,832 | $1,103,607 | $638,878 | $464,729 |
| 2021 | $14,581 | $1,081,968 | $626,351 | $455,617 |
| 2020 | $14,395 | $1,070,874 | $619,928 | $450,946 |
| 2019 | $14,783 | $1,049,877 | $607,773 | $442,104 |
| 2018 | $14,543 | $1,029,292 | $595,856 | $433,436 |
| 2017 | $14,335 | $1,009,110 | $584,172 | $424,938 |
| 2016 | $14,291 | $989,324 | $572,718 | $416,606 |
| 2015 | $14,108 | $974,464 | $564,115 | $410,349 |
| 2014 | $13,910 | $955,376 | $553,065 | $402,311 |
Source: Public Records
Map
Nearby Homes