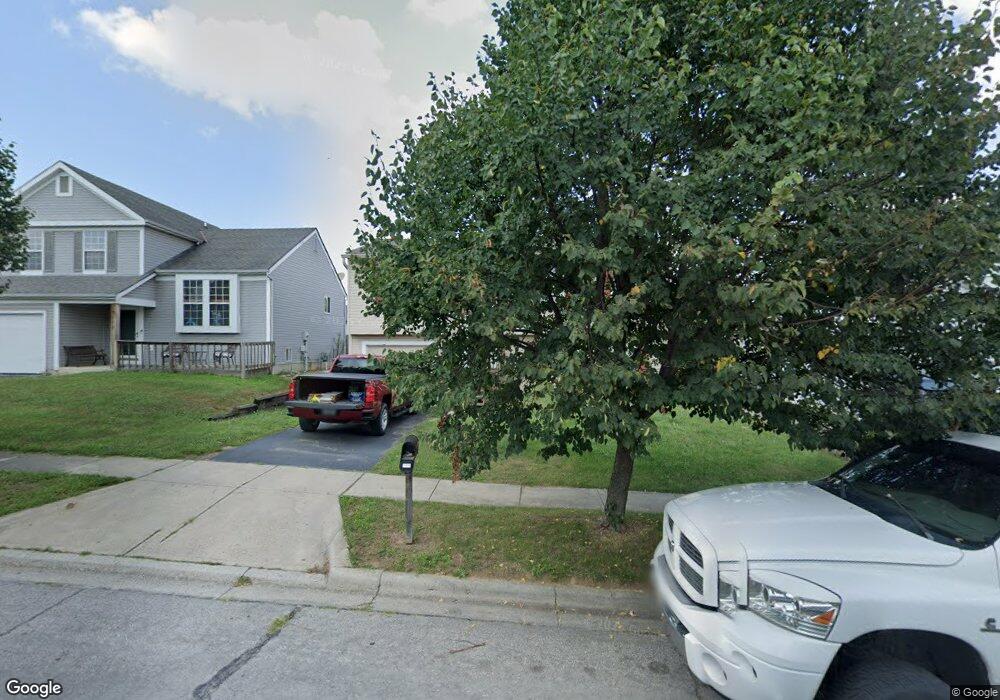
3600 Rocky Rd Columbus, OH 43223
Riverbend NeighborhoodEstimated Value: $250,482 - $267,000
3
Beds
2
Baths
1,400
Sq Ft
$183/Sq Ft
Est. Value
About This Home
This home is located at 3600 Rocky Rd, Columbus, OH 43223 and is currently estimated at $256,871, approximately $183 per square foot. 3600 Rocky Rd is a home located in Franklin County with nearby schools including James A Harmon Elementary School, Franklin Woods Intermediate School, and Finland Middle School.
Ownership History
Date
Name
Owned For
Owner Type
Purchase Details
Closed on
Apr 11, 2023
Sold by
Padamadan Premy M and Padamadan Syndie L
Bought by
Garcia Perez Miguel and Esparza Elizabeth C
Current Estimated Value
Home Financials for this Owner
Home Financials are based on the most recent Mortgage that was taken out on this home.
Original Mortgage
$176,000
Outstanding Balance
$171,109
Interest Rate
6.6%
Mortgage Type
Construction
Estimated Equity
$85,762
Purchase Details
Closed on
Feb 7, 2014
Sold by
Padamadan Premy M and Padamadan Premy Mary
Bought by
Padamadan Syndie L and Padamadan Premy M
Purchase Details
Closed on
Mar 27, 2002
Sold by
Hud
Bought by
Padamadan Premy M
Purchase Details
Closed on
Mar 5, 1996
Sold by
Rocky Creek Partners
Bought by
Sovereign Dev Corp
Create a Home Valuation Report for This Property
The Home Valuation Report is an in-depth analysis detailing your home's value as well as a comparison with similar homes in the area
Home Values in the Area
Average Home Value in this Area
Purchase History
| Date | Buyer | Sale Price | Title Company |
|---|---|---|---|
| Garcia Perez Miguel | $230,000 | Valmer Land Title | |
| Padamadan Syndie L | -- | None Available | |
| Padamadan Premy M | $80,000 | Contract Processing & Title | |
| Sovereign Dev Corp | $34,000 | -- |
Source: Public Records
Mortgage History
| Date | Status | Borrower | Loan Amount |
|---|---|---|---|
| Open | Garcia Perez Miguel | $176,000 |
Source: Public Records
Tax History Compared to Growth
Tax History
| Year | Tax Paid | Tax Assessment Tax Assessment Total Assessment is a certain percentage of the fair market value that is determined by local assessors to be the total taxable value of land and additions on the property. | Land | Improvement |
|---|---|---|---|---|
| 2024 | $2,483 | $68,110 | $15,750 | $52,360 |
| 2023 | $2,503 | $68,110 | $15,750 | $52,360 |
| 2022 | $2,177 | $43,470 | $8,400 | $35,070 |
| 2021 | $2,244 | $43,470 | $8,400 | $35,070 |
| 2020 | $2,209 | $43,470 | $8,400 | $35,070 |
| 2019 | $2,083 | $36,160 | $7,000 | $29,160 |
| 2018 | $2,268 | $36,160 | $7,000 | $29,160 |
| 2017 | $2,067 | $36,160 | $7,000 | $29,160 |
| 2016 | $2,026 | $32,550 | $6,790 | $25,760 |
| 2015 | $2,462 | $32,550 | $6,790 | $25,760 |
| 2014 | $2,028 | $32,550 | $6,790 | $25,760 |
| 2013 | $1,117 | $36,155 | $7,525 | $28,630 |
Source: Public Records
Map
Nearby Homes
- 3623 High Creek Dr
- 3488 Rocky Rd
- 1485 Demorest Rd
- 3728 Greenock Ct
- 1657 Ripplebrook Rd
- 1465 Tall Meadows Dr
- 1226 Pinnacle Dr
- 3206 Andy Terrace
- 3326 Bluhm Ct
- 1181 Onslow Dr
- 1830 Winding Hollow Dr
- 1612 Green Friar Dr
- 3814 Clime Rd
- 3766 Dunlane Ct
- 3360 Briggs Rd
- 2930 Alkire Rd
- 1027 S Brinker Ave
- 3551 Glorious Rd
- 2987 Daisy Ln
- 3318 Miriam Dr S
- 3592 Rocky Rd
- 3608 Rocky Rd
- 3586 Rocky Rd
- 3611 High Creek Dr
- 3597 High Creek Dr
- 3616 Rocky Rd
- 3589 High Creek Dr
- 3580 Rocky Rd
- 3599 Rocky Rd
- 3607 Rocky Rd
- 3581 High Creek Dr
- 3591 Rocky Rd
- 3615 Rocky Rd
- 3573 High Creek Dr
- 3574 Rocky Rd
- 3623 Rocky Rd
- 3585 Rocky Rd
- 3631 Rocky Rd
- 3565 High Creek Dr
- 3579 Rocky Rd