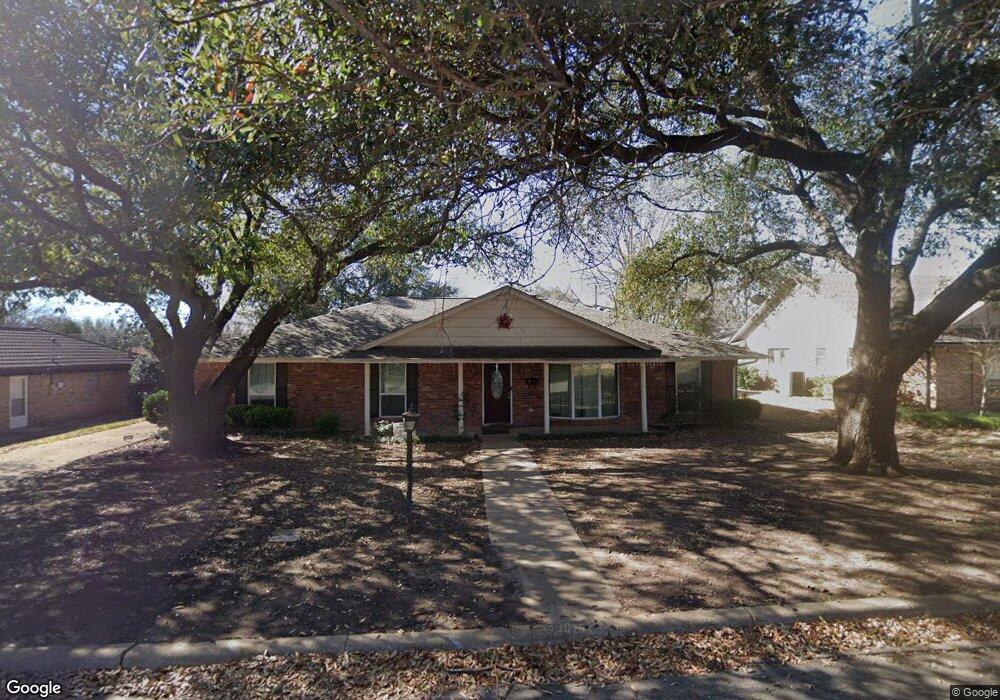
3601 Lawndale Ave Fort Worth, TX 76133
Wedgwood NeighborhoodEstimated Value: $319,397 - $339,000
3
Beds
2
Baths
2,049
Sq Ft
$160/Sq Ft
Est. Value
About This Home
This home is located at 3601 Lawndale Ave, Fort Worth, TX 76133 and is currently estimated at $328,349, approximately $160 per square foot. 3601 Lawndale Ave is a home located in Tarrant County with nearby schools including Westcreek Elementary School, Wedgwood Middle School, and Wedgwood Sixth Grade Center.
Ownership History
Date
Name
Owned For
Owner Type
Purchase Details
Closed on
Apr 14, 2015
Sold by
Brey George A
Bought by
Bowers Homes Llc
Current Estimated Value
Home Financials for this Owner
Home Financials are based on the most recent Mortgage that was taken out on this home.
Original Mortgage
$114,345
Outstanding Balance
$88,280
Interest Rate
3.82%
Mortgage Type
Purchase Money Mortgage
Estimated Equity
$240,069
Purchase Details
Closed on
Mar 28, 2003
Sold by
Hughes Floyd R and Hughes Lori J
Bought by
Marshall John S and Marshall Miriam M
Home Financials for this Owner
Home Financials are based on the most recent Mortgage that was taken out on this home.
Original Mortgage
$122,409
Interest Rate
5.83%
Mortgage Type
FHA
Purchase Details
Closed on
Sep 29, 1995
Sold by
Priddy Walter Lewis and Priddy Selena J
Bought by
Hughes Floyd R and Hughes Lori J
Home Financials for this Owner
Home Financials are based on the most recent Mortgage that was taken out on this home.
Original Mortgage
$69,600
Interest Rate
7.84%
Create a Home Valuation Report for This Property
The Home Valuation Report is an in-depth analysis detailing your home's value as well as a comparison with similar homes in the area
Home Values in the Area
Average Home Value in this Area
Purchase History
| Date | Buyer | Sale Price | Title Company |
|---|---|---|---|
| Bowers Homes Llc | -- | None Available | |
| Marshall John S | -- | Commonwealth Land Title | |
| Hughes Floyd R | -- | First American Title Co |
Source: Public Records
Mortgage History
| Date | Status | Borrower | Loan Amount |
|---|---|---|---|
| Open | Bowers Homes Llc | $114,345 | |
| Previous Owner | Marshall John S | $122,409 | |
| Previous Owner | Hughes Floyd R | $69,600 |
Source: Public Records
Tax History Compared to Growth
Tax History
| Year | Tax Paid | Tax Assessment Tax Assessment Total Assessment is a certain percentage of the fair market value that is determined by local assessors to be the total taxable value of land and additions on the property. | Land | Improvement |
|---|---|---|---|---|
| 2025 | $4,161 | $256,913 | $40,000 | $216,913 |
| 2024 | $4,161 | $256,913 | $40,000 | $216,913 |
| 2023 | $5,335 | $255,387 | $40,000 | $215,387 |
| 2022 | $5,572 | $214,323 | $40,000 | $174,323 |
| 2021 | $5,630 | $205,248 | $40,000 | $165,248 |
| 2020 | $5,789 | $232,421 | $40,000 | $192,421 |
| 2019 | $5,469 | $223,936 | $40,000 | $183,936 |
| 2018 | $4,350 | $180,750 | $30,000 | $150,750 |
| 2017 | $4,655 | $188,369 | $30,000 | $158,369 |
| 2016 | $4,232 | $185,238 | $30,000 | $155,238 |
| 2015 | -- | $135,800 | $20,000 | $115,800 |
| 2014 | -- | $135,800 | $20,000 | $115,800 |
Source: Public Records
Map
Nearby Homes
- 3529 Kelvin Ave
- 3516 Lawndale Ave
- 3433 Lawndale Ave
- 3700 Kelvin Ave
- 3537 Wedgworth Rd S
- 3709 Ashford Ave
- 3712 Lawndale Ave
- 5925 Rayburn Dr
- 6021 Rayburn Dr
- 3800 Wedgworth Rd S
- 3304 Wayland Dr
- 3605 Wayland Dr
- 3413 Denbury Dr
- 6900 Westcreek Cir
- 3821 Lawndale Ave
- 3420 Denbury Dr
- 3836 Wedgworth Rd S
- 6033 Worrell Dr
- 2828 Shasta Trail
- 6000 Wiser Ave
- 3605 Lawndale Ave
- 3521 Lawndale Ave
- 3608 Kelvin Ave
- 3608 Kelvin Ave
- 3612 Kelvin Ave
- 3604 Kelvin Ave
- 3517 Lawndale Ave
- 3616 Kelvin Ave
- 3600 Lawndale Ave
- 3609 Lawndale Ave
- 3604 Lawndale Ave
- 3520 Lawndale Ave
- 3600 Kelvin Ave
- 3620 Kelvin Ave
- 3608 Lawndale Ave
- 3513 Lawndale Ave
- 3613 Lawndale Ave
- 3528 Kelvin Ave
- 3624 Kelvin Ave
- 3609 Kelvin Ave