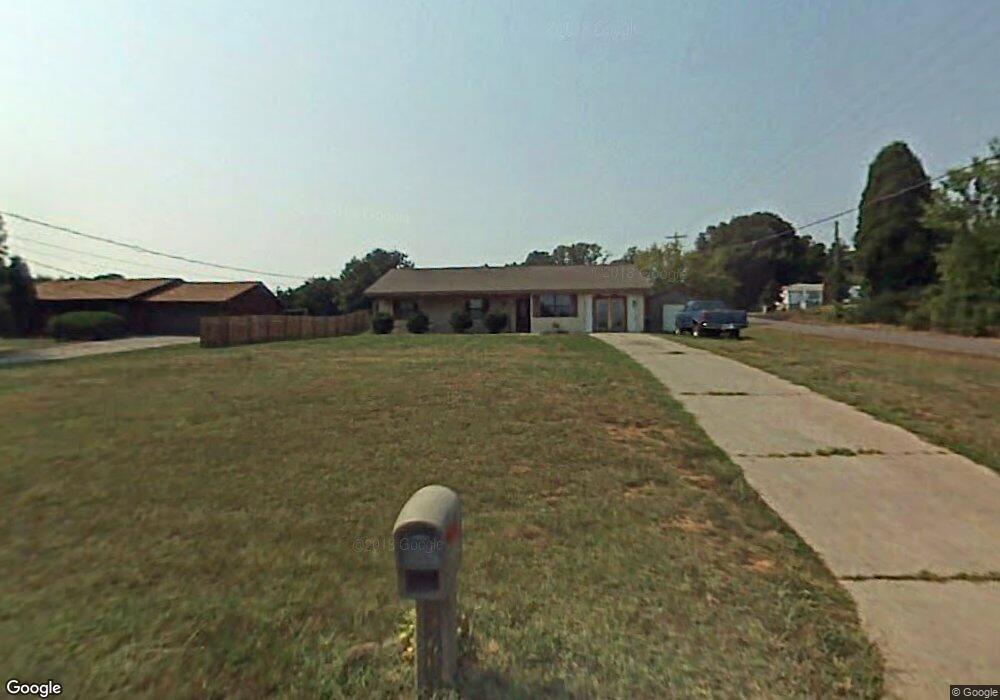
3601 Southfork Place Maryville, TN 37801
Estimated Value: $245,000 - $331,000
3
Beds
2
Baths
1,540
Sq Ft
$195/Sq Ft
Est. Value
About This Home
This home is located at 3601 Southfork Place, Maryville, TN 37801 and is currently estimated at $300,255, approximately $194 per square foot. 3601 Southfork Place is a home located in Blount County with nearby schools including Mary Blount Elementary School, Union Grove Middle School, and William Blount High School.
Ownership History
Date
Name
Owned For
Owner Type
Purchase Details
Closed on
Mar 5, 2021
Sold by
Haupt Becky L
Bought by
Brewer Macayla C
Current Estimated Value
Home Financials for this Owner
Home Financials are based on the most recent Mortgage that was taken out on this home.
Original Mortgage
$184,848
Outstanding Balance
$165,326
Interest Rate
2.7%
Mortgage Type
New Conventional
Estimated Equity
$134,929
Purchase Details
Closed on
Jul 23, 2008
Sold by
Raines Thomas R
Bought by
Haupt Becky L
Purchase Details
Closed on
May 22, 2008
Bought by
Household Financial Center Inc
Purchase Details
Closed on
Mar 17, 1997
Sold by
Nelson Douglas L and Nelson Judy K
Bought by
Raines Thomas
Purchase Details
Closed on
Oct 1, 1987
Bought by
Nelson Douglas L and Nelson Judy K
Purchase Details
Closed on
Mar 21, 1986
Bought by
Perkins Ralph A and Perkins Ladonna L
Create a Home Valuation Report for This Property
The Home Valuation Report is an in-depth analysis detailing your home's value as well as a comparison with similar homes in the area
Home Values in the Area
Average Home Value in this Area
Purchase History
| Date | Buyer | Sale Price | Title Company |
|---|---|---|---|
| Brewer Macayla C | $183,000 | -- | |
| Brewer Macayla C | $183,000 | None Listed On Document | |
| Haupt Becky L | $127,900 | -- | |
| Household Financial Center Inc | $116,900 | -- | |
| Raines Thomas | $72,900 | -- | |
| Nelson Douglas L | $53,000 | -- | |
| Perkins Ralph A | -- | -- |
Source: Public Records
Mortgage History
| Date | Status | Borrower | Loan Amount |
|---|---|---|---|
| Open | Brewer Macayla C | $184,848 | |
| Closed | Brewer Macayla C | $184,848 |
Source: Public Records
Tax History Compared to Growth
Tax History
| Year | Tax Paid | Tax Assessment Tax Assessment Total Assessment is a certain percentage of the fair market value that is determined by local assessors to be the total taxable value of land and additions on the property. | Land | Improvement |
|---|---|---|---|---|
| 2025 | $894 | $56,200 | $0 | $0 |
| 2024 | $894 | $56,200 | $12,500 | $43,700 |
| 2023 | $894 | $56,200 | $12,500 | $43,700 |
| 2022 | $799 | $32,350 | $7,500 | $24,850 |
| 2021 | $799 | $32,350 | $7,500 | $24,850 |
| 2020 | $799 | $32,350 | $7,500 | $24,850 |
| 2019 | $799 | $32,350 | $7,500 | $24,850 |
| 2018 | $760 | $30,750 | $6,875 | $23,875 |
| 2017 | $760 | $30,750 | $6,875 | $23,875 |
| 2016 | $760 | $30,750 | $6,875 | $23,875 |
| 2015 | $693 | $32,250 | $6,875 | $25,375 |
| 2014 | $627 | $32,250 | $6,875 | $25,375 |
| 2013 | $627 | $29,150 | $0 | $0 |
Source: Public Records
Map
Nearby Homes
- 3231 Reiley Dr
- 1414 Andera Dr
- 1153 Summerfield Dr
- 3621 Touchstone Dr
- 3445 Morganton Rd
- 126 Jerry Cardin Ln
- 1208 Ratledge Rd
- 1331 Woodside Park Dr
- 1424 John Sparks Dr
- 3115 Heather Glenn Dr
- 3443 Ardennes Dr
- 617 County Farm Rd
- 928 Walker Rd
- 3618 Big Springs Rd
- 1126 Kessler Way
- 3925 Clover Hill Mill Rd
- 3809 Clover Hill Mill Rd
- 534 Creole Dr
- 1757 Derby Downs Dr
- 3430 Ridgeway Trail
- 3605 Southfork Place
- 3605 Southfork Place
- 3602 Southfork Place
- 3609 Southfork Place
- 1005 Clendenen Rd
- 3602 Southfork Place
- 3608 Southfork Place
- 3613 Southfork Place
- 3613 S Fork Place
- 1016 Clendenen Rd
- 3612 S Fork Place
- 000 Reiley Dr
- 3612 Southfork Place
- 3617 Southfork Place
- 1025 Clendenen Rd
- 3616 Southfork Place
- 3550 Hawks Ridge Dr
- 3621 Southfork Place
- 3556 Hawks Ridge Dr
- 3620 Southfork Place