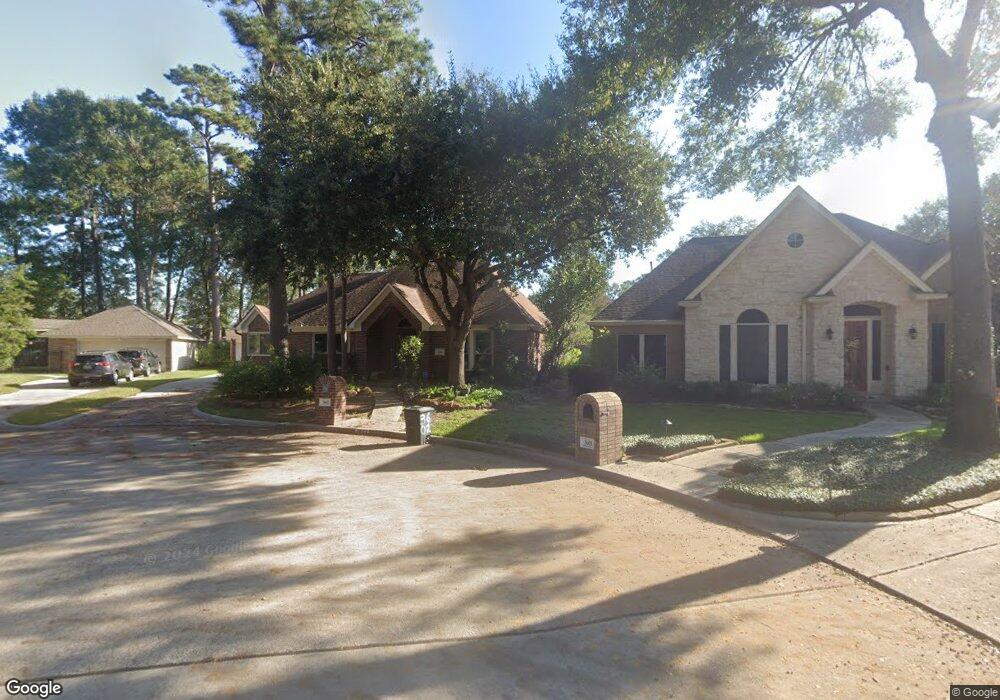
3602 Cedar Glen Ln Spring, TX 77388
Estimated Value: $396,530 - $418,000
3
Beds
3
Baths
2,814
Sq Ft
$144/Sq Ft
Est. Value
About This Home
This home is located at 3602 Cedar Glen Ln, Spring, TX 77388 and is currently estimated at $405,633, approximately $144 per square foot. 3602 Cedar Glen Ln is a home located in Harris County with nearby schools including Haude Elementary School, Strack Intermediate School, and Klein Collins High School.
Ownership History
Date
Name
Owned For
Owner Type
Purchase Details
Closed on
Jun 7, 2016
Sold by
Worontsoff Nicholas and Worontsoff Eugenia C
Bought by
Worontsoff Nicholas and Worontsoff Eugenia C
Current Estimated Value
Purchase Details
Closed on
Jan 31, 2002
Sold by
Price Joe Edd and Price Dianne L
Bought by
Worontsoff Nicholas and Worontsoff Eugenia C
Home Financials for this Owner
Home Financials are based on the most recent Mortgage that was taken out on this home.
Original Mortgage
$140,000
Outstanding Balance
$58,256
Interest Rate
7.15%
Estimated Equity
$347,377
Purchase Details
Closed on
Mar 16, 1994
Sold by
Emerald Texas Inc
Bought by
Price Joe Edd and Price Dianne L
Home Financials for this Owner
Home Financials are based on the most recent Mortgage that was taken out on this home.
Original Mortgage
$167,700
Interest Rate
6.96%
Create a Home Valuation Report for This Property
The Home Valuation Report is an in-depth analysis detailing your home's value as well as a comparison with similar homes in the area
Home Values in the Area
Average Home Value in this Area
Purchase History
| Date | Buyer | Sale Price | Title Company |
|---|---|---|---|
| Worontsoff Nicholas | -- | None Available | |
| Worontsoff Nicholas | -- | American Title Co | |
| Price Joe Edd | -- | Regency Title |
Source: Public Records
Mortgage History
| Date | Status | Borrower | Loan Amount |
|---|---|---|---|
| Open | Worontsoff Nicholas | $140,000 | |
| Previous Owner | Price Joe Edd | $167,700 |
Source: Public Records
Tax History Compared to Growth
Tax History
| Year | Tax Paid | Tax Assessment Tax Assessment Total Assessment is a certain percentage of the fair market value that is determined by local assessors to be the total taxable value of land and additions on the property. | Land | Improvement |
|---|---|---|---|---|
| 2025 | $3,269 | $387,416 | $61,951 | $325,465 |
| 2024 | $3,269 | $350,272 | $61,951 | $288,321 |
| 2023 | $3,269 | $370,079 | $61,951 | $308,128 |
| 2022 | $7,699 | $347,603 | $61,951 | $285,652 |
| 2021 | $7,522 | $289,806 | $44,433 | $245,373 |
| 2020 | $7,306 | $246,946 | $44,433 | $202,513 |
| 2019 | $7,619 | $246,946 | $44,433 | $202,513 |
| 2018 | $2,944 | $230,853 | $44,433 | $186,420 |
| 2017 | $7,303 | $235,000 | $44,433 | $190,567 |
| 2016 | $7,459 | $240,000 | $44,433 | $195,567 |
| 2015 | $6,023 | $240,000 | $44,433 | $195,567 |
| 2014 | $6,023 | $209,854 | $44,433 | $165,421 |
Source: Public Records
Map
Nearby Homes
- 3614 Cedar Glen Ln
- 20106 Forest Dr
- 3711 Sapling Trail Ct
- 20011 Rosswood Ln
- 3702 Cypresswood Meadows Ct
- 20614 Cypresswood Meadows Dr
- 2615 Piemonte Ln
- 3602 Vashon Ln
- 19315 Puget Ln
- 20518 Benwest Ct
- 19007 Pinewood Glen Dr
- 20702 La Cote Cir
- 20011 Glen Lake Dr
- 19218 Country Village Dr
- 3411 Blue Candle Dr
- 3318 Candlelon Dr
- 20115 Shavon Ct
- 3411 Lost Oak Dr
- 3306 Candlelon Dr
- 3302 Candlelon Dr
- 3603 Cedar Glen Ln
- 3606 Cedar Glen Ln
- 20211 Cypresswood Glen Dr
- 20207 Cypresswood Glen Dr
- 20010 Forest Dr
- 20014 Forest Dr
- 3610 Cedar Glen Ln
- 3607 Cedar Glen Ln
- 3527 Ash Glen Dr
- 20215 Cypresswood Glen Dr
- 3523 Ash Glen Dr
- 20018 Forest Dr
- 20203 Cypresswood Glen Dr
- 3603 Ash Glen Dr
- 3519 Ash Glen Dr
- 3611 Cedar Glen Ln
- 20022 Forest Dr
- 3515 Ash Glen Dr
- 3607 Ash Glen Dr
- 20210 Cypresswood Glen Dr