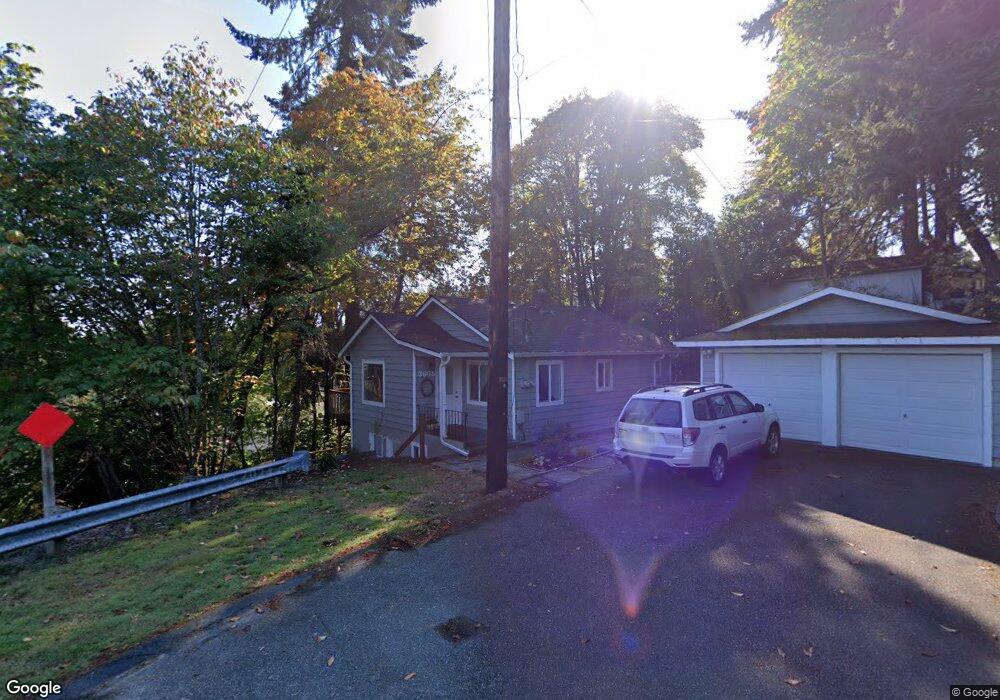
3605 9th St Bremerton, WA 98312
Charleston NeighborhoodEstimated Value: $336,000 - $394,089
2
Beds
2
Baths
780
Sq Ft
$468/Sq Ft
Est. Value
About This Home
This home is located at 3605 9th St, Bremerton, WA 98312 and is currently estimated at $365,272, approximately $468 per square foot. 3605 9th St is a home located in Kitsap County with nearby schools including West Hills S.T.E.M. Academy, Mountain View Middle School, and Bremerton High School.
Ownership History
Date
Name
Owned For
Owner Type
Purchase Details
Closed on
Aug 11, 2004
Sold by
2004 Genengels Family Llc
Bought by
Turnquist David L and Turnquist Katherine L
Current Estimated Value
Home Financials for this Owner
Home Financials are based on the most recent Mortgage that was taken out on this home.
Original Mortgage
$132,000
Outstanding Balance
$65,327
Interest Rate
5.97%
Mortgage Type
Purchase Money Mortgage
Estimated Equity
$299,945
Purchase Details
Closed on
Apr 2, 2004
Sold by
Genengels Theodore and Genengels Carol
Bought by
Genengels Family Llc
Purchase Details
Closed on
Mar 30, 1999
Sold by
Genengels Shawn B
Bought by
Genengels Theodore F and Genengels Carol L
Purchase Details
Closed on
Dec 13, 1996
Sold by
Laing Steven M
Bought by
Genengels Theodore F and Genengels Carol L
Home Financials for this Owner
Home Financials are based on the most recent Mortgage that was taken out on this home.
Original Mortgage
$65,700
Interest Rate
5.87%
Create a Home Valuation Report for This Property
The Home Valuation Report is an in-depth analysis detailing your home's value as well as a comparison with similar homes in the area
Home Values in the Area
Average Home Value in this Area
Purchase History
| Date | Buyer | Sale Price | Title Company |
|---|---|---|---|
| Turnquist David L | $165,000 | Pacific Nw Title | |
| Genengels Family Llc | -- | -- | |
| Genengels Theodore F | -- | -- | |
| Genengels Theodore F | $73,000 | Land Title Co |
Source: Public Records
Mortgage History
| Date | Status | Borrower | Loan Amount |
|---|---|---|---|
| Open | Turnquist David L | $132,000 | |
| Previous Owner | Genengels Theodore F | $65,700 |
Source: Public Records
Tax History Compared to Growth
Tax History
| Year | Tax Paid | Tax Assessment Tax Assessment Total Assessment is a certain percentage of the fair market value that is determined by local assessors to be the total taxable value of land and additions on the property. | Land | Improvement |
|---|---|---|---|---|
| 2026 | $2,994 | $339,310 | $80,920 | $258,390 |
| 2025 | $2,994 | $339,310 | $80,920 | $258,390 |
| 2024 | $2,889 | $339,310 | $80,920 | $258,390 |
| 2023 | $2,986 | $339,310 | $80,920 | $258,390 |
| 2022 | $2,792 | $285,220 | $67,430 | $217,790 |
| 2021 | $1,980 | $185,130 | $50,860 | $134,270 |
| 2020 | $1,842 | $172,030 | $47,070 | $124,960 |
| 2019 | $1,586 | $153,500 | $41,580 | $111,920 |
| 2018 | $1,627 | $101,730 | $31,260 | $70,470 |
| 2017 | $1,333 | $101,730 | $31,260 | $70,470 |
| 2016 | $1,246 | $90,010 | $27,420 | $62,590 |
| 2015 | $1,215 | $87,320 | $29,820 | $57,500 |
| 2014 | -- | $84,280 | $29,820 | $54,460 |
| 2013 | -- | $95,070 | $31,480 | $63,590 |
Source: Public Records
Map
Nearby Homes
- 931 Oyster Bay Ct
- 347 Dora Ave
- 500 N National Ave Unit 37
- 2613 Burwell St
- 1135 Morgan Rd NW Unit A & B
- 1309 Times Ave
- 1303 Times Ave
- 923 Pershing Ave Unit 205
- 921 Pershing Ave Unit 203
- 320 N Lafayette Ave
- 1 XXXX 1st St
- 122 National Ave S
- 114 S Lafayette Ave
- 3201 17th St
- 107 N Callow Ave
- 205 S Summit Ave
- 0 S Hartford Ave
- 231 S Yantic Ave
- 232 S Yantic Ave
- 234 S Yantic Ave