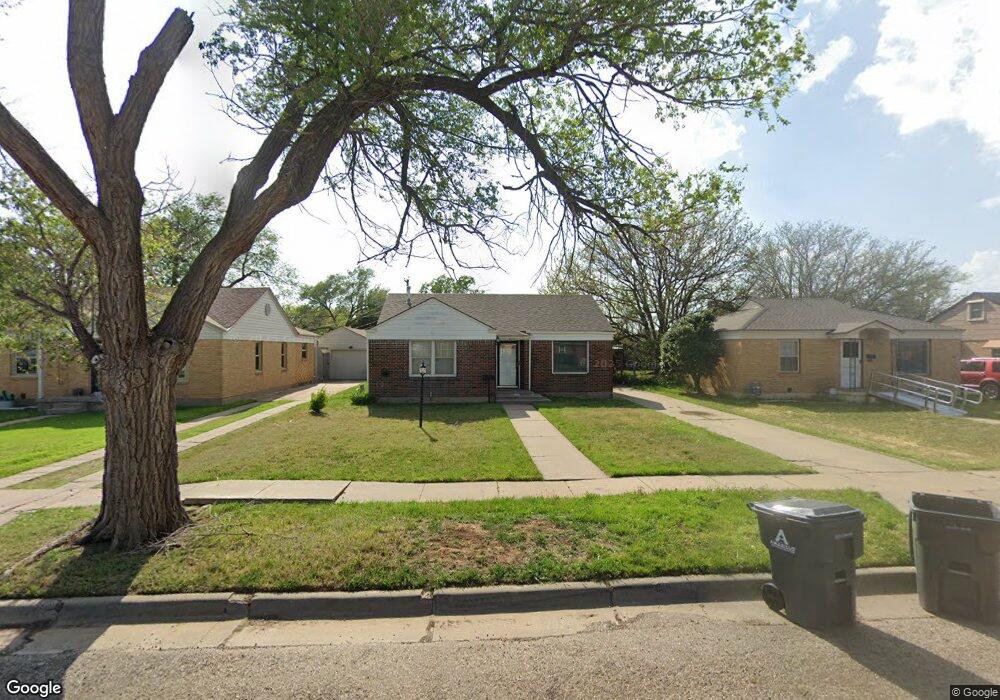
3610 S Ong St Amarillo, TX 79110
South Lawn NeighborhoodEstimated Value: $120,039 - $143,000
2
Beds
1
Bath
1,026
Sq Ft
$129/Sq Ft
Est. Value
About This Home
This home is located at 3610 S Ong St, Amarillo, TX 79110 and is currently estimated at $132,010, approximately $128 per square foot. 3610 S Ong St is a home located in Randall County with nearby schools including Lamar Elementary School, Carver Early Childhood Academy, and George Washington Carver Elementary Academy.
Ownership History
Date
Name
Owned For
Owner Type
Purchase Details
Closed on
Aug 23, 2013
Sold by
Bunn Charisa Morgan and Bunn Morgan
Bought by
Bunn Michael Loran and Bunn Michael
Current Estimated Value
Home Financials for this Owner
Home Financials are based on the most recent Mortgage that was taken out on this home.
Original Mortgage
$61,017
Interest Rate
4.36%
Mortgage Type
Purchase Money Mortgage
Create a Home Valuation Report for This Property
The Home Valuation Report is an in-depth analysis detailing your home's value as well as a comparison with similar homes in the area
Home Values in the Area
Average Home Value in this Area
Purchase History
| Date | Buyer | Sale Price | Title Company |
|---|---|---|---|
| Bunn Michael Loran | -- | Chicago Title Of Texas Llc |
Source: Public Records
Mortgage History
| Date | Status | Borrower | Loan Amount |
|---|---|---|---|
| Closed | Bunn Michael Loran | $61,017 |
Source: Public Records
Tax History Compared to Growth
Tax History
| Year | Tax Paid | Tax Assessment Tax Assessment Total Assessment is a certain percentage of the fair market value that is determined by local assessors to be the total taxable value of land and additions on the property. | Land | Improvement |
|---|---|---|---|---|
| 2025 | $2,628 | $147,149 | $6,250 | $140,899 |
| 2024 | $2,628 | $139,269 | $6,250 | $133,019 |
| 2023 | $2,666 | $137,452 | $6,250 | $131,202 |
| 2022 | $2,647 | $124,202 | $6,250 | $117,952 |
| 2021 | $2,185 | $98,217 | $6,250 | $91,967 |
| 2020 | $2,072 | $93,072 | $6,250 | $86,822 |
| 2019 | $2,091 | $93,072 | $6,250 | $86,822 |
| 2018 | $1,923 | $88,416 | $6,250 | $82,166 |
| 2017 | $1,809 | $83,691 | $6,250 | $77,441 |
| 2016 | $1,702 | $77,845 | $6,250 | $71,595 |
| 2015 | $1,666 | $77,845 | $6,250 | $71,595 |
| 2014 | $1,666 | $77,845 | $6,250 | $71,595 |
Source: Public Records
Map
Nearby Homes
- 3416 S Ong St
- 3808 S Ong St
- 3403 S Hayden St
- 3611 Parker St
- 3205 S Ong St
- 1609 SW 35th Ave
- 4006 S Hughes St
- 3207 Parker St
- 3703 S Jackson St
- 3705 S Jackson St
- 3813 Gables St
- 3007 S Ong St
- 3220 S Travis St
- 4103 Cline Rd
- 33 Oldham Cir
- 3506 Crockett St
- 3211 Bowie St
- 3701 S Van Buren St
- 3003 S Hughes St
- 3409 S Van Buren St
- 3612 S Ong St
- 3608 S Ong St
- 3614 S Ong St
- 3606 S Ong St
- 3609 S Lipscomb St
- 3611 S Lipscomb St
- 3607 S Lipscomb St
- 3613 S Lipscomb St
- 3604 S Ong St
- 3616 S Ong St
- 3605 S Lipscomb St
- 3615 S Lipscomb St
- 3611 S Ong St
- 3613 S Ong St
- 3609 S Ong St
- 3618 S Ong St
- 3602 S Ong St
- 3615 S Ong St
- 3615 S Ong St
- 3607 S Ong St