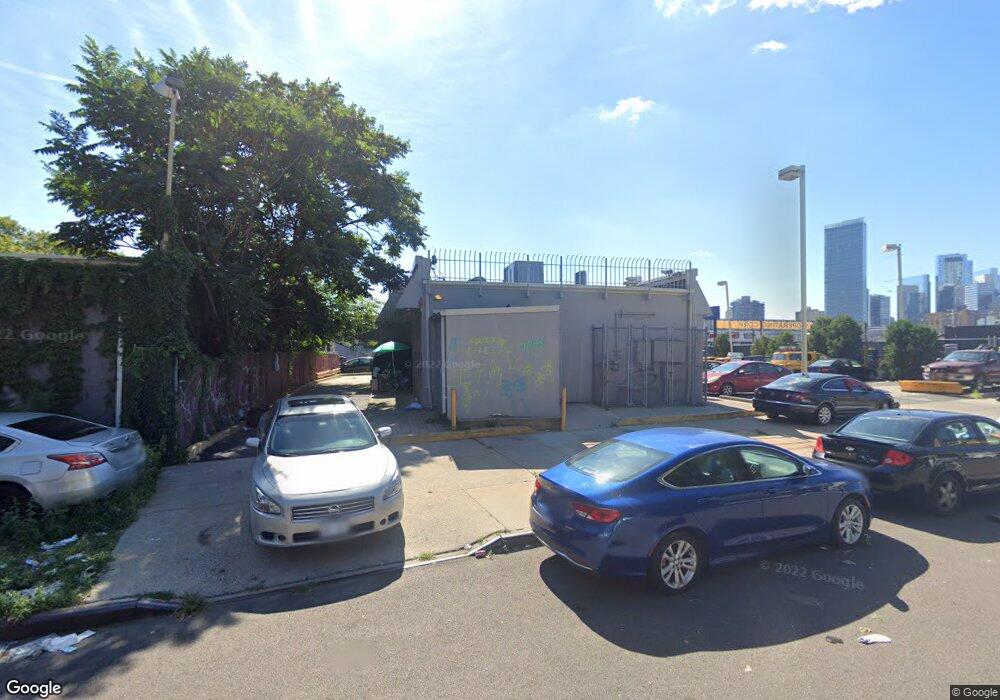
3616 21st St Long Island City, NY 11106
Long Island City NeighborhoodEstimated Value: $3,396,080
--
Bed
--
Bath
2,500
Sq Ft
$1,358/Sq Ft
Est. Value
About This Home
This home is located at 3616 21st St, Long Island City, NY 11106 and is currently estimated at $3,396,080, approximately $1,358 per square foot. 3616 21st St is a home located in Queens County with nearby schools including P.S. 111 - Jacob Blackwell, I.S. 204 Oliver W. Holmes, and Long Island City High School.
Ownership History
Date
Name
Owned For
Owner Type
Purchase Details
Closed on
Jan 12, 2006
Sold by
36-18 21St Street Llc
Bought by
21St Street Mani Corp
Current Estimated Value
Purchase Details
Closed on
Jun 14, 2005
Sold by
Kfc Us Properties Inc
Bought by
36-18 21St Street Llc
Purchase Details
Closed on
Dec 31, 2002
Sold by
Kfc Corporation
Bought by
Kfc U S Properties Inc
Create a Home Valuation Report for This Property
The Home Valuation Report is an in-depth analysis detailing your home's value as well as a comparison with similar homes in the area
Home Values in the Area
Average Home Value in this Area
Purchase History
| Date | Buyer | Sale Price | Title Company |
|---|---|---|---|
| 21St Street Mani Corp | $2,000,000 | -- | |
| 21St Street Mani Corp | $2,000,000 | -- | |
| 36-18 21St Street Llc | $1,215,000 | -- | |
| 36-18 21St Street Llc | $1,215,000 | -- | |
| Kfc U S Properties Inc | -- | -- | |
| Kfc U S Properties Inc | -- | -- |
Source: Public Records
Tax History Compared to Growth
Tax History
| Year | Tax Paid | Tax Assessment Tax Assessment Total Assessment is a certain percentage of the fair market value that is determined by local assessors to be the total taxable value of land and additions on the property. | Land | Improvement |
|---|---|---|---|---|
| 2025 | $42,945 | $738,360 | $414,900 | $323,460 |
| 2024 | $42,945 | $744,570 | $405,450 | $339,120 |
| 2023 | $42,158 | $756,810 | $396,000 | $360,810 |
| 2022 | $41,573 | $755,100 | $386,550 | $368,550 |
| 2021 | $41,136 | $628,650 | $386,550 | $242,100 |
| 2020 | $43,652 | $842,400 | $386,550 | $455,850 |
| 2019 | $41,768 | $842,850 | $386,550 | $456,300 |
| 2018 | $39,979 | $763,380 | $348,750 | $414,630 |
| 2017 | $38,191 | $707,040 | $331,740 | $375,300 |
| 2016 | $36,810 | $707,040 | $331,740 | $375,300 |
| 2015 | $450 | $615,960 | $301,500 | $314,460 |
| 2014 | $450 | $580,050 | $282,420 | $297,630 |
Source: Public Records
Map
Nearby Homes
- 36-26 11th St
- 36-13 10th St
- 35-30 10th St
- 28-07 36th Ave
- 34-57 9th St
- 3411 11th St
- 38 ave 27th St
- 3814 27th St
- 21-15 34th Ave Unit 3A
- 21-15 34th Ave Unit 11C
- 35-35 28th St
- 3529 28th St
- 37-34 28th St
- 21-41 34th Ave Unit 7B
- 33-55 14th St Unit 15B
- 3433 9th St
- 21-55 34th Ave Unit 3C
- 13-09 40th Ave
- 21-71 34th Ave Unit 15D
- 21-71 34th Ave Unit 11B