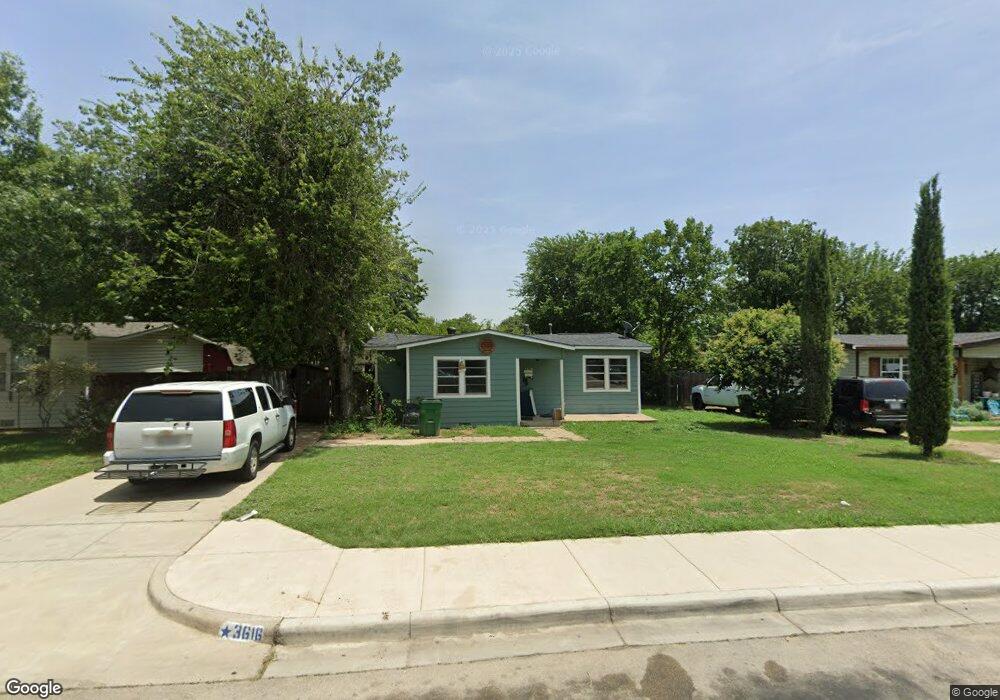
3616 Cheryl St Haltom City, TX 76117
Estimated Value: $194,000 - $250,000
3
Beds
1
Bath
1,064
Sq Ft
$201/Sq Ft
Est. Value
About This Home
This home is located at 3616 Cheryl St, Haltom City, TX 76117 and is currently estimated at $213,809, approximately $200 per square foot. 3616 Cheryl St is a home located in Tarrant County with nearby schools including W T Francisco Elementary School, Haltom Middle School, and Haltom High School.
Ownership History
Date
Name
Owned For
Owner Type
Purchase Details
Closed on
Jun 21, 2017
Sold by
Martinez Alfonso Garcia
Bought by
Martinez Mariana Hernandez
Current Estimated Value
Purchase Details
Closed on
May 20, 2014
Sold by
Ivy Lane Properties Llc
Bought by
Martinez Alfonso Garcia and Martinez Mariana Hernandez
Home Financials for this Owner
Home Financials are based on the most recent Mortgage that was taken out on this home.
Original Mortgage
$23,000
Interest Rate
4.32%
Mortgage Type
Purchase Money Mortgage
Purchase Details
Closed on
Feb 25, 2014
Sold by
Shaffer Grant W
Bought by
Ivy Lane Properties Llc
Purchase Details
Closed on
Jun 15, 1999
Sold by
Hud
Bought by
Harden Patrick
Purchase Details
Closed on
Nov 3, 1998
Sold by
Fleet Mtg Corp
Bought by
Hud
Create a Home Valuation Report for This Property
The Home Valuation Report is an in-depth analysis detailing your home's value as well as a comparison with similar homes in the area
Home Values in the Area
Average Home Value in this Area
Purchase History
| Date | Buyer | Sale Price | Title Company |
|---|---|---|---|
| Martinez Mariana Hernandez | -- | None Available | |
| Martinez Alfonso Garcia | -- | None Available | |
| Ivy Lane Properties Llc | -- | None Available | |
| Harden Patrick | $23,000 | -- | |
| Hud | -- | -- | |
| Fleet Mtg Corp | $42,225 | -- |
Source: Public Records
Mortgage History
| Date | Status | Borrower | Loan Amount |
|---|---|---|---|
| Closed | Martinez Alfonso Garcia | $23,000 |
Source: Public Records
Tax History Compared to Growth
Tax History
| Year | Tax Paid | Tax Assessment Tax Assessment Total Assessment is a certain percentage of the fair market value that is determined by local assessors to be the total taxable value of land and additions on the property. | Land | Improvement |
|---|---|---|---|---|
| 2025 | $2,855 | $126,271 | $42,380 | $83,891 |
| 2024 | $2,855 | $126,271 | $42,380 | $83,891 |
| 2023 | $2,831 | $124,629 | $42,380 | $82,249 |
| 2022 | $2,407 | $97,587 | $29,666 | $67,921 |
| 2021 | $2,174 | $82,534 | $12,000 | $70,534 |
| 2020 | $2,467 | $93,524 | $12,000 | $81,524 |
| 2019 | $2,288 | $84,699 | $12,000 | $72,699 |
| 2018 | $2,005 | $74,234 | $12,000 | $62,234 |
| 2017 | $1,793 | $64,491 | $12,000 | $52,491 |
| 2016 | $1,027 | $36,922 | $12,000 | $24,922 |
| 2015 | $500 | $18,000 | $12,400 | $5,600 |
| 2014 | $500 | $55,700 | $12,400 | $43,300 |
Source: Public Records
Map
Nearby Homes
- 3637 Cheryl St
- 4804 Jerri Ln
- 4321 Voncille St
- 4809 Monna St
- 3736 Layton Ave
- 4229 Voncille St
- 4417 Mckibben St
- 4709 Nadine Dr
- 3317 Swan St
- 3628 Glenda St
- 4700 Roxie St
- 4404 Mckibben St
- 3509 Glenda St
- 4208 Patricia St
- 4201 Mckibben St
- 3641 Larry St
- 3516 Haltom Rd
- 5005 Roxie St
- 4521 Gary Dr
- 3420 Tommy Watkins Dr