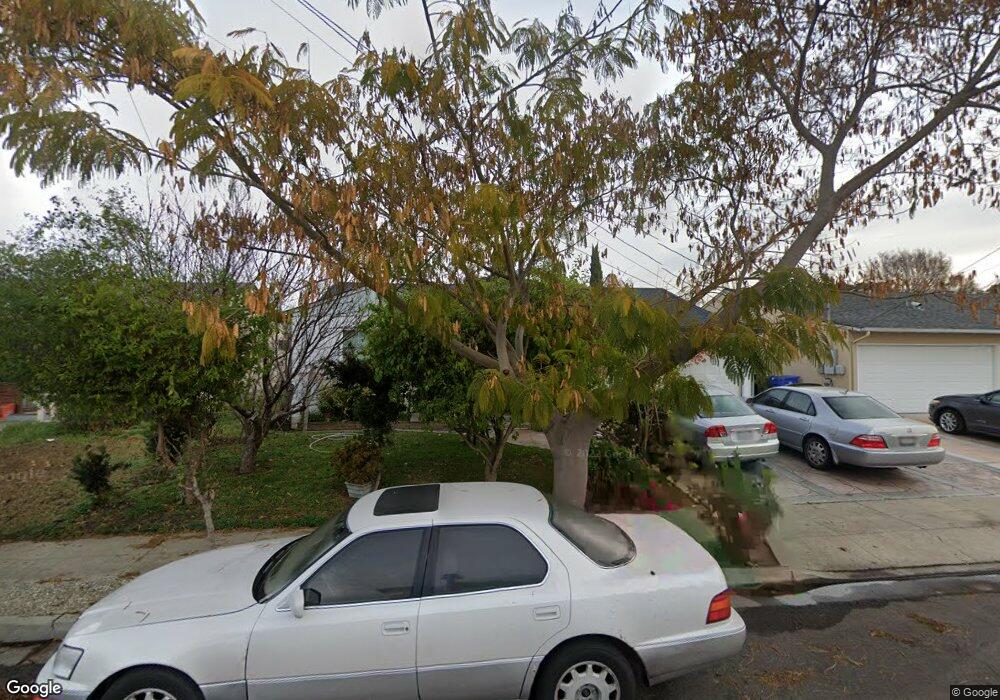
36218 Magellan Dr Fremont, CA 94536
Estimated Value: $988,000 - $1,335,000
3
Beds
1
Bath
1,106
Sq Ft
$1,080/Sq Ft
Est. Value
About This Home
This home is located at 36218 Magellan Dr, Fremont, CA 94536 and is currently estimated at $1,194,206, approximately $1,079 per square foot. 36218 Magellan Dr is a home located in Alameda County with nearby schools including Cabrillo Elementary School, Centerville Junior High School, and Washington High School.
Ownership History
Date
Name
Owned For
Owner Type
Purchase Details
Closed on
Nov 18, 2021
Sold by
Vazquez Patricia
Bought by
Patricia Vazquez Trust and Vazquez
Current Estimated Value
Purchase Details
Closed on
Jun 6, 2002
Sold by
Wolff Lee Larry and Wolff Suree
Bought by
Vazquez Patricia
Home Financials for this Owner
Home Financials are based on the most recent Mortgage that was taken out on this home.
Original Mortgage
$230,000
Interest Rate
6.74%
Purchase Details
Closed on
Feb 21, 2002
Sold by
Wolff Lee Larry
Bought by
Wolff Lee Larry and Wolff Suree
Home Financials for this Owner
Home Financials are based on the most recent Mortgage that was taken out on this home.
Original Mortgage
$162,500
Interest Rate
6.8%
Create a Home Valuation Report for This Property
The Home Valuation Report is an in-depth analysis detailing your home's value as well as a comparison with similar homes in the area
Home Values in the Area
Average Home Value in this Area
Purchase History
| Date | Buyer | Sale Price | Title Company |
|---|---|---|---|
| Patricia Vazquez Trust | -- | Anthoor Swapna | |
| Vazquez Patricia | $360,000 | American Title Co | |
| Wolff Lee Larry | -- | -- |
Source: Public Records
Mortgage History
| Date | Status | Borrower | Loan Amount |
|---|---|---|---|
| Previous Owner | Vazquez Patricia | $230,000 | |
| Previous Owner | Wolff Lee Larry | $162,500 |
Source: Public Records
Tax History Compared to Growth
Tax History
| Year | Tax Paid | Tax Assessment Tax Assessment Total Assessment is a certain percentage of the fair market value that is determined by local assessors to be the total taxable value of land and additions on the property. | Land | Improvement |
|---|---|---|---|---|
| 2025 | $6,648 | $524,791 | $159,537 | $372,254 |
| 2024 | $6,648 | $514,365 | $156,409 | $364,956 |
| 2023 | $6,461 | $511,145 | $153,343 | $357,802 |
| 2022 | $6,364 | $494,123 | $150,337 | $350,786 |
| 2021 | $6,210 | $484,298 | $147,389 | $343,909 |
| 2020 | $6,188 | $486,261 | $145,878 | $340,383 |
| 2019 | $6,118 | $476,730 | $143,019 | $333,711 |
| 2018 | $5,996 | $467,384 | $140,215 | $327,169 |
| 2017 | $5,846 | $458,221 | $137,466 | $320,755 |
| 2016 | $5,740 | $449,240 | $134,772 | $314,468 |
| 2015 | $5,657 | $442,493 | $132,748 | $309,745 |
| 2014 | $5,554 | $433,828 | $130,148 | $303,680 |
Source: Public Records
Map
Nearby Homes
- 36304 Magellan Dr
- 36347 Magellan Dr
- 35978 Magellan Dr
- 35942 Adobe Dr
- 36521 Cabrillo Dr
- 36139 San Pedro Dr
- 35936 Magellan Dr
- 35856 Adobe Dr
- 4412 Elaiso Common
- 4955 Swindon Place
- 4632 Balboa Way
- 35794 Cabral Dr
- 36202 Worthing Dr
- 4543 Bartolo Terrace
- 4987 Winchester Place
- 36288 Saxon Ct
- 37001 Contra Costa Ave
- 4544 Thornton Ave
- 5139 Dryden Ct
- 4637 Rothbury Common
- 36206 Magellan Dr
- 36230 Magellan Dr
- 36229 Cabrillo Dr
- 36243 Cabrillo Dr
- 36242 Magellan Dr
- 36215 Cabrillo Dr
- 36257 Cabrillo Dr
- 36217 Magellan Dr
- 36205 Magellan Dr
- 36182 Magellan Dr
- 36229 Magellan Dr
- 36187 Cabrillo Dr
- 36254 Magellan Dr
- 36271 Cabrillo Dr
- 36193 Magellan Dr
- 36253 Magellan Dr
- 36179 Cabrillo Dr
- 36170 Magellan Dr
- 36323 Cabrillo Dr
- 36181 Magellan Dr