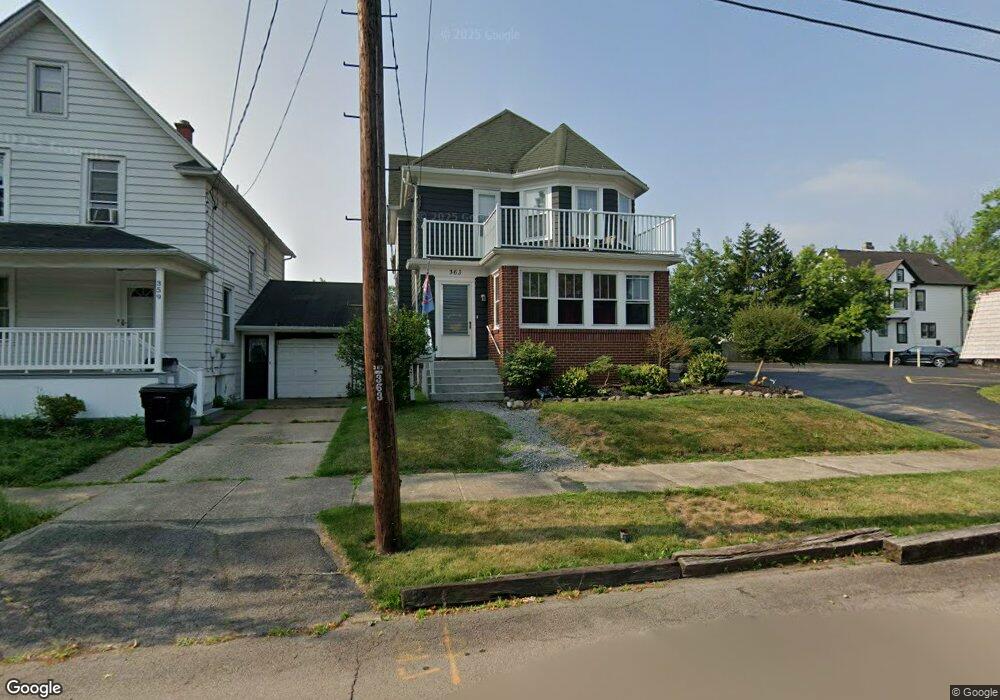
363 Utica St Tonawanda, NY 14150
Estimated Value: $204,000 - $304,000
4
Beds
2
Baths
2,011
Sq Ft
$122/Sq Ft
Est. Value
About This Home
This home is located at 363 Utica St, Tonawanda, NY 14150 and is currently estimated at $245,782, approximately $122 per square foot. 363 Utica St is a home located in Erie County with nearby schools including Mullen Elementary School, Tonawanda Elementary School, and Tonawanda Middle High School.
Ownership History
Date
Name
Owned For
Owner Type
Purchase Details
Closed on
Jun 21, 2006
Sold by
Panty Lillian
Bought by
Frears Leonard M and Frears Christina M
Current Estimated Value
Home Financials for this Owner
Home Financials are based on the most recent Mortgage that was taken out on this home.
Original Mortgage
$79,540
Outstanding Balance
$46,841
Interest Rate
6.6%
Mortgage Type
Purchase Money Mortgage
Estimated Equity
$198,941
Create a Home Valuation Report for This Property
The Home Valuation Report is an in-depth analysis detailing your home's value as well as a comparison with similar homes in the area
Home Values in the Area
Average Home Value in this Area
Purchase History
| Date | Buyer | Sale Price | Title Company |
|---|---|---|---|
| Frears Leonard M | $82,000 | Ticor Title Insurance Co |
Source: Public Records
Mortgage History
| Date | Status | Borrower | Loan Amount |
|---|---|---|---|
| Open | Frears Leonard M | $79,540 |
Source: Public Records
Tax History Compared to Growth
Tax History
| Year | Tax Paid | Tax Assessment Tax Assessment Total Assessment is a certain percentage of the fair market value that is determined by local assessors to be the total taxable value of land and additions on the property. | Land | Improvement |
|---|---|---|---|---|
| 2024 | $2,675 | $177,000 | $9,500 | $167,500 |
| 2023 | $2,153 | $177,000 | $9,500 | $167,500 |
| 2022 | $1,846 | $83,000 | $9,900 | $73,100 |
| 2021 | $1,839 | $83,000 | $9,900 | $73,100 |
| 2020 | $1,353 | $83,000 | $9,900 | $73,100 |
| 2019 | $2,739 | $83,000 | $9,900 | $73,100 |
| 2018 | $1,287 | $83,000 | $9,900 | $73,100 |
| 2017 | $484 | $80,000 | $9,300 | $70,700 |
| 2016 | $1,357 | $80,000 | $9,300 | $70,700 |
| 2015 | -- | $80,000 | $9,300 | $70,700 |
| 2014 | -- | $80,000 | $9,300 | $70,700 |
Source: Public Records
Map
Nearby Homes