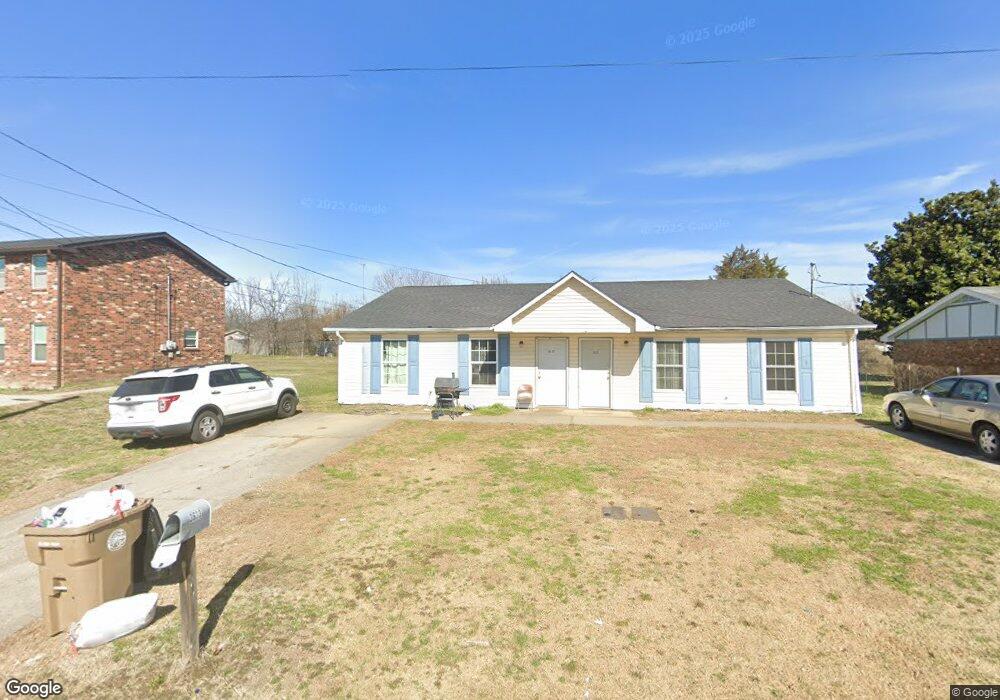
3633 Village Trail Nashville, TN 37207
Bellshire Terrace NeighborhoodEstimated Value: $323,000 - $351,000
6
Beds
4
Baths
1,950
Sq Ft
$171/Sq Ft
Est. Value
About This Home
This home is located at 3633 Village Trail, Nashville, TN 37207 and is currently estimated at $333,578, approximately $171 per square foot. 3633 Village Trail is a home located in Davidson County with nearby schools including Bellshire Elementary Design Center, Madison Middle Prep, and Hunters Lane Comprehensive High School.
Ownership History
Date
Name
Owned For
Owner Type
Purchase Details
Closed on
Mar 23, 2010
Sold by
Aurora Loan Services Llc
Bought by
Cook Marvin
Current Estimated Value
Purchase Details
Closed on
Jan 28, 2010
Sold by
Rosenboro Myron
Bought by
Aurora Loan Services Llc
Purchase Details
Closed on
Nov 20, 2006
Sold by
Williams Thomas C and Williams Heather
Bought by
Rosenboro Myron
Home Financials for this Owner
Home Financials are based on the most recent Mortgage that was taken out on this home.
Original Mortgage
$100,000
Interest Rate
9.6%
Mortgage Type
Unknown
Purchase Details
Closed on
Jan 28, 2005
Sold by
Claybon Joseph and Claybon Barbara
Bought by
Williams Thomas C and Williams Heather
Home Financials for this Owner
Home Financials are based on the most recent Mortgage that was taken out on this home.
Original Mortgage
$230,775
Interest Rate
5.62%
Mortgage Type
Unknown
Purchase Details
Closed on
Dec 31, 2002
Sold by
Jim Sweeney Construction Inc
Bought by
Sweeney James S
Create a Home Valuation Report for This Property
The Home Valuation Report is an in-depth analysis detailing your home's value as well as a comparison with similar homes in the area
Home Values in the Area
Average Home Value in this Area
Purchase History
| Date | Buyer | Sale Price | Title Company |
|---|---|---|---|
| Cook Marvin | $45,000 | None Available | |
| Aurora Loan Services Llc | $59,400 | None Available | |
| Rosenboro Myron | $100,000 | Infinity Title Llc | |
| Williams Thomas C | $271,500 | Cumberland Title | |
| Sweeney James S | -- | -- |
Source: Public Records
Mortgage History
| Date | Status | Borrower | Loan Amount |
|---|---|---|---|
| Previous Owner | Rosenboro Myron | $100,000 | |
| Previous Owner | Williams Thomas C | $230,775 | |
| Closed | Williams Thomas C | $26,225 |
Source: Public Records
Tax History Compared to Growth
Tax History
| Year | Tax Paid | Tax Assessment Tax Assessment Total Assessment is a certain percentage of the fair market value that is determined by local assessors to be the total taxable value of land and additions on the property. | Land | Improvement |
|---|---|---|---|---|
| 2024 | $2,628 | $80,760 | $22,000 | $58,760 |
| 2023 | $2,628 | $80,760 | $22,000 | $58,760 |
| 2022 | $2,628 | $80,760 | $22,000 | $58,760 |
| 2021 | $2,655 | $80,760 | $22,000 | $58,760 |
| 2020 | $1,750 | $46,200 | $9,200 | $37,000 |
| 2019 | $1,273 | $46,200 | $9,200 | $37,000 |
| 2018 | $1,273 | $46,200 | $9,200 | $37,000 |
| 2017 | $1,273 | $46,200 | $9,200 | $37,000 |
| 2016 | $1,022 | $26,040 | $4,800 | $21,240 |
| 2015 | $1,022 | $26,040 | $4,800 | $21,240 |
| 2014 | $1,022 | $26,040 | $4,800 | $21,240 |
Source: Public Records
Map
Nearby Homes
- 3320 Chesapeake Cir
- 3172 Lauren Evelyn Way
- 3253 Rainwood Dr
- 3247 Masonwood Dr
- 3136 Lauren Evelyn Way
- 1533 Thornton Grove Blvd
- 116 Tiger Cir
- 3946 Northbrook Dr
- 3116 Lauren Evelyn Way
- 4125 Walnut Ridge Dr
- 4105 Walnut Ridge Dr
- 4113 Walnut Ridge Dr
- 2935 Winterberry Dr Unit 31
- 2935 Winterberry Dr Unit 12
- 4137 Walnut Ridge Dr
- 3313 Leondale Terrace
- 4325 Skyridge Dr
- 4108 Walnut Ridge Dr
- 4348 Skyridge Dr
- 2665 Thornton Grove Blvd
- 3631 Village Trail
- 3637 Village Trail
- 3629 Village Trail
- 409 Standing Stone Ct
- 3627 Village Trail
- 3641 Village Trail
- 3625 Village Trail
- 405 Standing Stone Ct
- 3628 Village Trail
- 3630 Village Trail
- 3624 Village Trail
- 408 Standing Stone Ct
- 3623 Village Trail
- 3645 Village Trail
- 3621 Village Trail
- 3632 Village Trail
- 3517 Standing Stone Dr
- 3619 Village Trail
- 3513 Standing Stone Dr
- 401 Standing Stone Ct