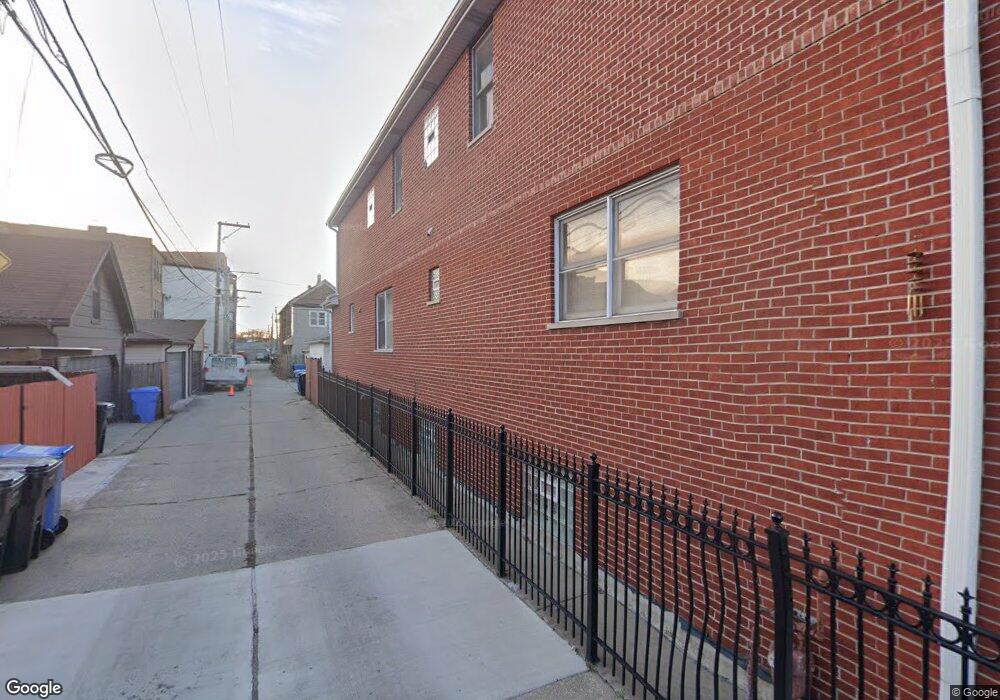
3646 S Parnell Ave Chicago, IL 60609
Bridgeport NeighborhoodEstimated Value: $723,000 - $999,000
5
Beds
3
Baths
2,547
Sq Ft
$319/Sq Ft
Est. Value
About This Home
This home is located at 3646 S Parnell Ave, Chicago, IL 60609 and is currently estimated at $811,854, approximately $318 per square foot. 3646 S Parnell Ave is a home located in Cook County with nearby schools including McClellan Elementary School, Bridgeport Catholic Academy - South Campus, and St Gabriel Elementary School.
Ownership History
Date
Name
Owned For
Owner Type
Purchase Details
Closed on
Jan 24, 2023
Sold by
Tam Lai Wan
Bought by
Yuen Kuan C and Tam Lai Wan
Current Estimated Value
Purchase Details
Closed on
Apr 26, 2011
Sold by
Yuen Kuan C
Bought by
Tam Lai Wan
Purchase Details
Closed on
Oct 5, 2001
Sold by
Walkosz John and Walkosz Maria
Bought by
Tam Lai Wan and Yuen Kuan C
Home Financials for this Owner
Home Financials are based on the most recent Mortgage that was taken out on this home.
Original Mortgage
$150,000
Interest Rate
6.88%
Purchase Details
Closed on
Sep 19, 2001
Sold by
Clark Thomas and Clark Paula
Bought by
Walkosz John and Walkosz Maria
Home Financials for this Owner
Home Financials are based on the most recent Mortgage that was taken out on this home.
Original Mortgage
$150,000
Interest Rate
6.88%
Create a Home Valuation Report for This Property
The Home Valuation Report is an in-depth analysis detailing your home's value as well as a comparison with similar homes in the area
Home Values in the Area
Average Home Value in this Area
Purchase History
| Date | Buyer | Sale Price | Title Company |
|---|---|---|---|
| Yuen Kuan C | -- | None Listed On Document | |
| Tam Lai Wan | -- | None Available | |
| Tam Lai Wan | -- | 1St American Title | |
| Walkosz John | -- | 1St American Title |
Source: Public Records
Mortgage History
| Date | Status | Borrower | Loan Amount |
|---|---|---|---|
| Previous Owner | Tam Lai Wan | $150,000 |
Source: Public Records
Tax History Compared to Growth
Tax History
| Year | Tax Paid | Tax Assessment Tax Assessment Total Assessment is a certain percentage of the fair market value that is determined by local assessors to be the total taxable value of land and additions on the property. | Land | Improvement |
|---|---|---|---|---|
| 2024 | $11,327 | $66,000 | $16,868 | $49,132 |
| 2023 | $11,020 | $57,000 | $13,618 | $43,382 |
| 2022 | $11,020 | $57,000 | $13,618 | $43,382 |
| 2021 | $10,792 | $57,000 | $13,618 | $43,382 |
| 2020 | $10,812 | $51,636 | $13,618 | $38,018 |
| 2019 | $10,968 | $58,018 | $13,618 | $44,400 |
| 2018 | $10,782 | $58,018 | $13,618 | $44,400 |
| 2017 | $9,632 | $48,121 | $10,832 | $37,289 |
| 2016 | $9,138 | $48,121 | $10,832 | $37,289 |
| 2015 | $8,337 | $48,121 | $10,832 | $37,289 |
| 2014 | $7,391 | $42,402 | $9,285 | $33,117 |
| 2013 | $7,234 | $42,402 | $9,285 | $33,117 |
Source: Public Records
Map
Nearby Homes
- 3549 S Lowe Ave
- 3640 S Lowe Ave
- 3505 S Parnell Ave Unit D
- 3727 S Lowe Ave
- 3600 S Union Ave
- 455 W 38th St
- 3416 S Union Ave
- 3600 S Halsted St
- 3405 S Union Ave
- 3322 S Parnell Ave
- 3357 S Emerald Ave
- 3830 S Emerald Ave
- 3450 S Halsted St Unit 406
- 3315 S Lowe Ave
- 835 W 35th St
- 3246 S Normal Ave
- 3247 S Emerald Ave
- 917 W 34th Place
- 3500 S Sangamon St Unit 214
- 3214 S Canal St
- 3644 S Parnell Ave
- 3644 S Parnell Ave Unit 2
- 3642 S Parnell Ave
- 3640 S Parnell Ave
- 538 W 37th St
- 538 W 37th St Unit 2
- 540 W 37th St
- 534 W 37th St
- 3636 S Parnell Ave
- 542 W 37th St
- 544 W 37th St
- 3634 S Parnell Ave
- 548 W 37th St
- 3632 S Parnell Ave
- 3632 S Parnell Ave Unit 1R
- 3632 S Parnell Ave Unit 2F
- 3632 S Parnell Ave
- 3647 S Wallace St
- 3647 S Wallace St Unit 1
- 3647 S Wallace St