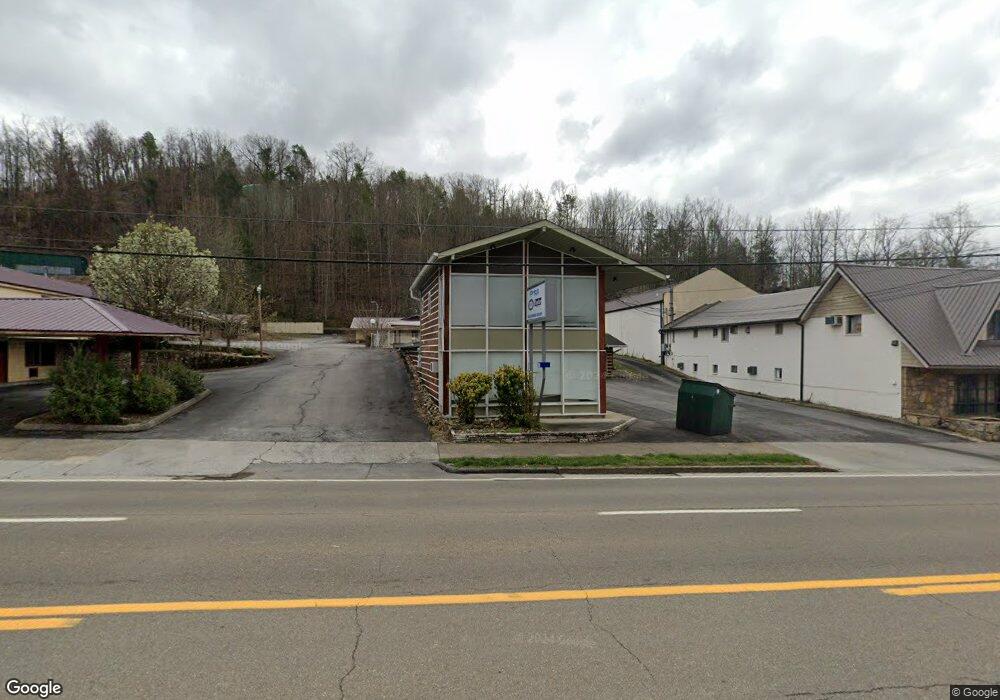
366 E Parkway Gatlinburg, TN 37738
Estimated Value: $437,203
--
Bed
7
Baths
2,704
Sq Ft
$162/Sq Ft
Est. Value
About This Home
This home is located at 366 E Parkway, Gatlinburg, TN 37738 and is currently estimated at $437,203, approximately $161 per square foot. 366 E Parkway is a home located in Sevier County with nearby schools including Catons Chapel Elementary School, Northview Elementary School, and Jones Cove Elementary School.
Ownership History
Date
Name
Owned For
Owner Type
Purchase Details
Closed on
Dec 1, 2015
Sold by
Lemka Investments Llc
Bought by
Decision Resources Llc
Current Estimated Value
Purchase Details
Closed on
Jun 20, 2013
Sold by
Lemka Kenneth Ray
Bought by
Lemka Investments Llc
Purchase Details
Closed on
Sep 17, 2012
Sold by
Kukreja Kailash M
Bought by
Lemka Jason R and Lemka Kenneth R
Home Financials for this Owner
Home Financials are based on the most recent Mortgage that was taken out on this home.
Original Mortgage
$148,500
Interest Rate
3.71%
Mortgage Type
Commercial
Purchase Details
Closed on
Apr 19, 2004
Sold by
Bise Danny F
Bought by
Kukreja Kailash M
Purchase Details
Closed on
Jul 6, 1998
Sold by
And Bise Danny and And Charlotte
Bought by
Bise Danny
Purchase Details
Closed on
Oct 26, 1995
Sold by
Butler Jack C
Bought by
Bise Danny
Create a Home Valuation Report for This Property
The Home Valuation Report is an in-depth analysis detailing your home's value as well as a comparison with similar homes in the area
Home Values in the Area
Average Home Value in this Area
Purchase History
| Date | Buyer | Sale Price | Title Company |
|---|---|---|---|
| Decision Resources Llc | $165,000 | -- | |
| Lemka Investments Llc | -- | -- | |
| Lemka Jason R | $198,000 | -- | |
| Kukreja Kailash M | $266,000 | -- | |
| Bise Danny | -- | -- | |
| Bise Danny | $250,000 | -- |
Source: Public Records
Mortgage History
| Date | Status | Borrower | Loan Amount |
|---|---|---|---|
| Previous Owner | Lemka Jason R | $148,500 |
Source: Public Records
Tax History Compared to Growth
Tax History
| Year | Tax Paid | Tax Assessment Tax Assessment Total Assessment is a certain percentage of the fair market value that is determined by local assessors to be the total taxable value of land and additions on the property. | Land | Improvement |
|---|---|---|---|---|
| 2025 | $1,015 | $68,600 | $53,920 | $14,680 |
| 2024 | $1,015 | $68,600 | $53,920 | $14,680 |
| 2023 | $1,015 | $68,600 | $0 | $0 |
| 2022 | $1,101 | $68,600 | $53,920 | $14,680 |
| 2021 | $1,101 | $68,600 | $53,920 | $14,680 |
| 2020 | $1,352 | $68,600 | $53,920 | $14,680 |
| 2019 | $1,354 | $67,040 | $53,920 | $13,120 |
| 2018 | $1,354 | $67,040 | $53,920 | $13,120 |
| 2017 | $1,354 | $67,040 | $53,920 | $13,120 |
| 2016 | $1,354 | $67,040 | $53,920 | $13,120 |
| 2015 | -- | $74,920 | $0 | $0 |
| 2014 | $1,340 | $74,913 | $0 | $0 |
Source: Public Records
Map
Nearby Homes
- 368 East Pkwy
- 375 East Pkwy
- 348 East Pkwy
- 344 East Pkwy
- 376 East Pkwy
- 309 East Pkwy
- 234 Sycamore Ln
- 102 Baskins Creek Bypass Unit 505
- 102 Baskins Creek Bypass
- 102 Baskins Creek Bypass Unit 108
- 102 Baskins Creek Bypass Unit 107
- 102 Baskins Creek Bypass Unit 209
- 180 East Pkwy
- 146 East Pkwy
- 131 East Pkwy
- 203 East Pkwy
- 282 East Pkwy
- 341 Silverbell Heights Ln
- 0 Silverbell Heights Ln
- 109 East Pkwy
- 366 East Pkwy Unit O6/P/
- 366 East Pkwy Unit P/06
- 350 East Pkwy
- 346 E Parkway
- 362 E Parkway
- 376 East Pkwy
- 349 E Parkway
- 349 E Parkway
- 349 E Parkway Unit Lot 349 vacant
- 349 E Parkway
- 365 East Pkwy
- 371 East Pkwy
- 328 East Pkwy
- 143 Lr Reagan Way
- 376 E Parkway
- 382 East Pkwy
- 152 Lr Reagan Way
- 324 E Parkway
- 324 East Pkwy Unit 1
- 335 East Pkwy