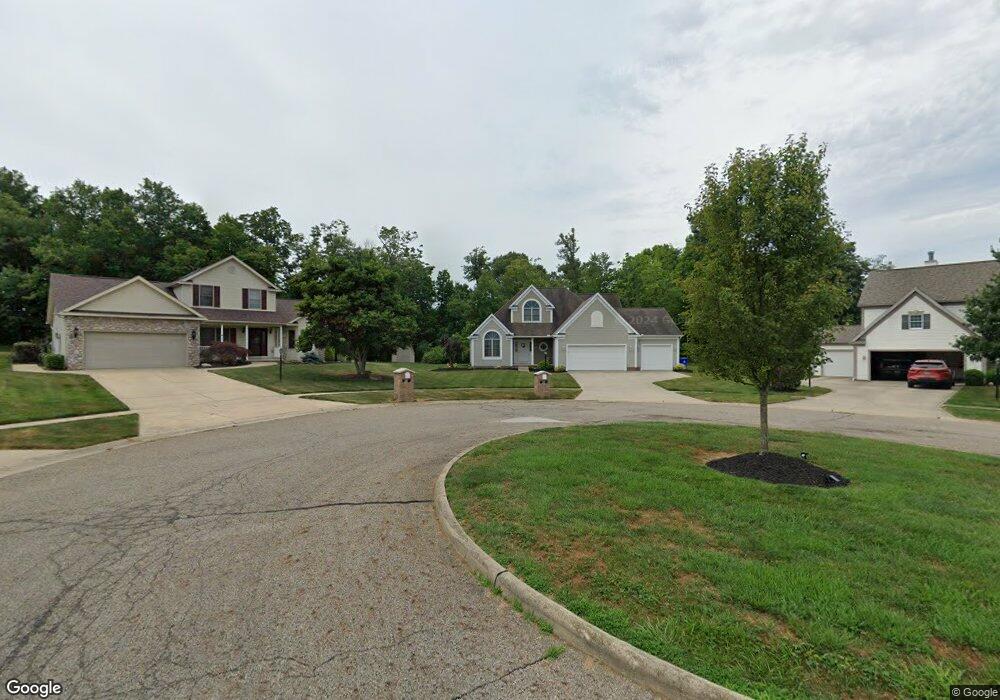
3663 Cranberry Hill Rootstown, OH 44272
Estimated Value: $375,000 - $422,000
4
Beds
3
Baths
2,384
Sq Ft
$170/Sq Ft
Est. Value
About This Home
This home is located at 3663 Cranberry Hill, Rootstown, OH 44272 and is currently estimated at $404,414, approximately $169 per square foot. 3663 Cranberry Hill is a home located in Portage County with nearby schools including Rootstown Middle School - Schnee Building and Rootstown High School.
Ownership History
Date
Name
Owned For
Owner Type
Purchase Details
Closed on
Jun 5, 2002
Sold by
Elson J Hershberger Construction Inc
Bought by
Krunich Jerome D and Amlani Anita K
Current Estimated Value
Home Financials for this Owner
Home Financials are based on the most recent Mortgage that was taken out on this home.
Original Mortgage
$220,309
Outstanding Balance
$106,004
Interest Rate
7.75%
Estimated Equity
$298,410
Purchase Details
Closed on
Apr 26, 2002
Sold by
Clover Pointe Land Development Ltd Llc
Bought by
Elson J Hershberger Construction Inc
Home Financials for this Owner
Home Financials are based on the most recent Mortgage that was taken out on this home.
Original Mortgage
$220,309
Outstanding Balance
$106,004
Interest Rate
7.75%
Estimated Equity
$298,410
Create a Home Valuation Report for This Property
The Home Valuation Report is an in-depth analysis detailing your home's value as well as a comparison with similar homes in the area
Home Values in the Area
Average Home Value in this Area
Purchase History
| Date | Buyer | Sale Price | Title Company |
|---|---|---|---|
| Krunich Jerome D | $33,900 | Midland Commerce Group | |
| Elson J Hershberger Construction Inc | $36,000 | Midland Commerce Group |
Source: Public Records
Mortgage History
| Date | Status | Borrower | Loan Amount |
|---|---|---|---|
| Open | Krunich Jerome D | $220,309 | |
| Closed | Elson J Hershberger Construction Inc | $27,000 |
Source: Public Records
Tax History Compared to Growth
Tax History
| Year | Tax Paid | Tax Assessment Tax Assessment Total Assessment is a certain percentage of the fair market value that is determined by local assessors to be the total taxable value of land and additions on the property. | Land | Improvement |
|---|---|---|---|---|
| 2024 | $5,285 | $133,880 | $14,700 | $119,180 |
| 2023 | $4,201 | $94,960 | $12,880 | $82,080 |
| 2022 | $4,167 | $94,960 | $12,880 | $82,080 |
| 2021 | $4,183 | $94,960 | $12,880 | $82,080 |
| 2020 | $3,739 | $81,800 | $12,250 | $69,550 |
| 2019 | $3,752 | $81,800 | $12,250 | $69,550 |
| 2018 | $3,445 | $71,510 | $12,250 | $59,260 |
| 2017 | $3,445 | $71,510 | $12,250 | $59,260 |
| 2016 | $3,412 | $71,510 | $12,250 | $59,260 |
| 2015 | $3,450 | $71,510 | $12,250 | $59,260 |
| 2014 | $3,515 | $71,510 | $12,250 | $59,260 |
| 2013 | $3,490 | $71,510 | $12,250 | $59,260 |
Source: Public Records
Map
Nearby Homes
- 3987 J A Vaughn Ave
- 0 Rootstown Rd Unit 5173350
- 0 Lynn Rd Unit 5110102
- 0 New Milford Rd Unit 11489599
- 0 New Milford Rd Unit 5108183
- 4326 Clover Dr
- V/L 2 Lynn Rd
- V/L Lynn Rd
- 3637 Old Forge Rd
- 3021 Hartville Rd
- 4691 Scenic Dr
- 3807 Industry Rd
- 4770 Valley Hills Dr
- sub lot Lane Ave
- 4958 Bassett Rd
- 2322 New Milford Rd
- 5560 Wilkes Rd
- 2547 Industry Rd
- 2113 New Milford Rd
- 2236 Hartville Rd
- 3667 Cranberry Hill
- 3660 Cranberry Hill
- 3675 Cranberry Hill
- 3664 Cranberry Hill
- 3668 Cranberry Hill
- 4386 Pletzer Blvd
- 3657 Cook Rd
- 3676 Cranberry Hill
- 3687 Cranberry Hill
- 4399 Apple Orchard
- 4396 Pletzer Blvd
- 3688 Cranberry Hill
- 3617 Cook Rd
- 4382 Pletzer Blvd
- 4393 Apple Orchard
- 4405 Pletzer Blvd
- 4399 Pletzer Blvd
- 4411 Pletzer Blvd
- 4393 Pletzer Blvd
- 4402 Apple Orchard