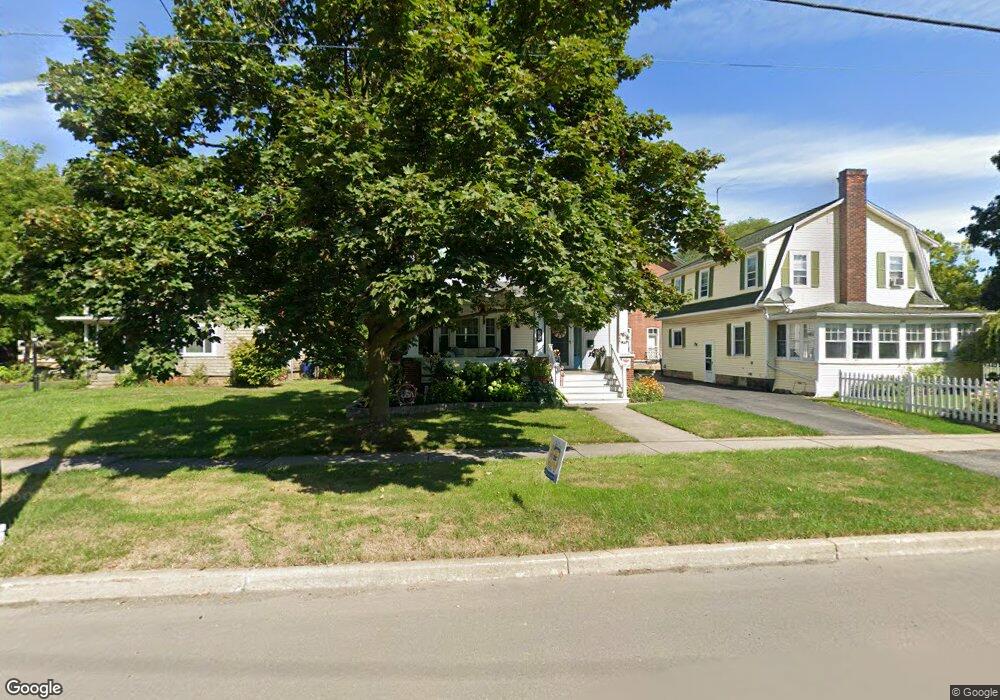
367 East Ave Lockport, NY 14094
Estimated Value: $169,000 - $236,000
4
Beds
2
Baths
1,752
Sq Ft
$120/Sq Ft
Est. Value
About This Home
This home is located at 367 East Ave, Lockport, NY 14094 and is currently estimated at $210,542, approximately $120 per square foot. 367 East Ave is a home located in Niagara County with nearby schools including Aaron Mossell Junior High School, Lockport High School, and DeSales Catholic School.
Ownership History
Date
Name
Owned For
Owner Type
Purchase Details
Closed on
Feb 4, 2011
Sold by
Mckenna Susan J
Bought by
Mckenna David E and Mckenna Susan J
Current Estimated Value
Purchase Details
Closed on
Oct 26, 2009
Sold by
Scinta Margaret
Bought by
Mckenna Susan
Home Financials for this Owner
Home Financials are based on the most recent Mortgage that was taken out on this home.
Original Mortgage
$80,000
Outstanding Balance
$52,477
Interest Rate
5.09%
Mortgage Type
New Conventional
Estimated Equity
$158,065
Create a Home Valuation Report for This Property
The Home Valuation Report is an in-depth analysis detailing your home's value as well as a comparison with similar homes in the area
Home Values in the Area
Average Home Value in this Area
Purchase History
| Date | Buyer | Sale Price | Title Company |
|---|---|---|---|
| Mckenna David E | -- | None Available | |
| Mckenna Susan | $100,000 | John Nuchereno | |
| Mckenna Susan J | $100,000 | None Available |
Source: Public Records
Mortgage History
| Date | Status | Borrower | Loan Amount |
|---|---|---|---|
| Open | Mckenna Susan J | $80,000 |
Source: Public Records
Tax History Compared to Growth
Tax History
| Year | Tax Paid | Tax Assessment Tax Assessment Total Assessment is a certain percentage of the fair market value that is determined by local assessors to be the total taxable value of land and additions on the property. | Land | Improvement |
|---|---|---|---|---|
| 2024 | $2,939 | $158,000 | $4,800 | $153,200 |
| 2023 | $2,900 | $152,000 | $4,800 | $147,200 |
| 2022 | $1,945 | $136,000 | $4,800 | $131,200 |
| 2021 | $2,354 | $97,100 | $5,300 | $91,800 |
| 2020 | $2,150 | $97,100 | $5,300 | $91,800 |
| 2019 | $839 | $97,100 | $5,300 | $91,800 |
| 2018 | $1,112 | $97,100 | $5,300 | $91,800 |
| 2017 | $1,009 | $94,300 | $5,300 | $89,000 |
| 2016 | $927 | $94,300 | $5,300 | $89,000 |
| 2015 | -- | $94,300 | $5,300 | $89,000 |
| 2014 | -- | $94,300 | $5,300 | $89,000 |
Source: Public Records
Map
Nearby Homes