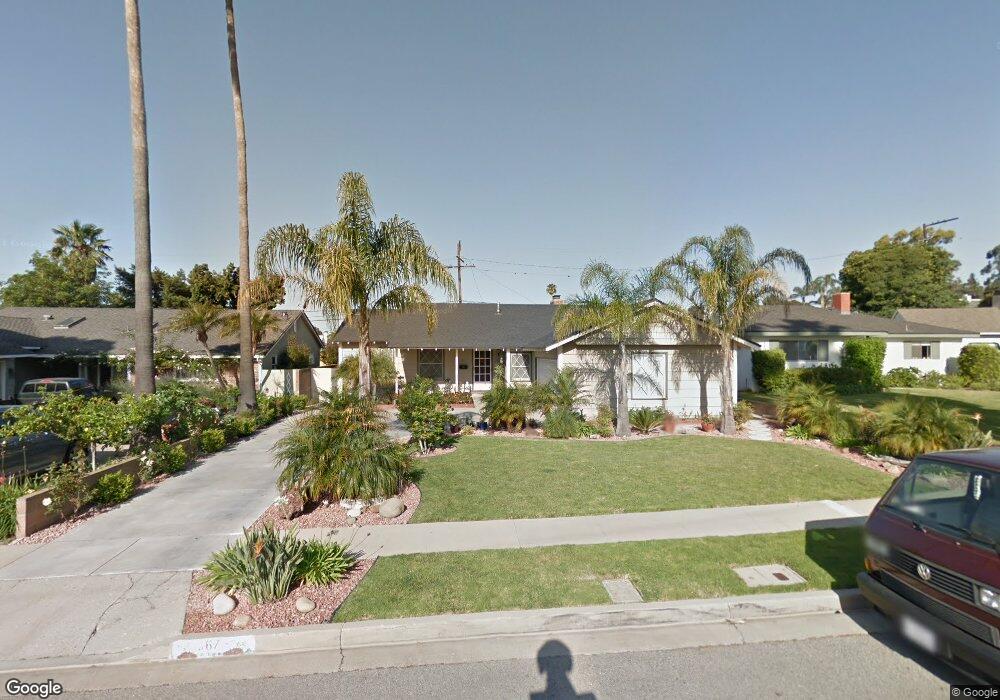
367 Homer Ave Ventura, CA 93003
Midtown NeighborhoodEstimated Value: $946,000 - $1,350,000
4
Beds
2
Baths
1,527
Sq Ft
$751/Sq Ft
Est. Value
About This Home
This home is located at 367 Homer Ave, Ventura, CA 93003 and is currently estimated at $1,147,007, approximately $751 per square foot. 367 Homer Ave is a home located in Ventura County with nearby schools including Loma Vista Elementary School, Cabrillo Middle School, and Ventura High School.
Ownership History
Date
Name
Owned For
Owner Type
Purchase Details
Closed on
May 16, 2017
Sold by
Tebbe Mark G and Tebbe Siu Po L
Bought by
Tebbe Mark G and Tebbe Siu Po Lemon
Current Estimated Value
Purchase Details
Closed on
Dec 11, 2015
Sold by
Tebbe Mark G and Tebbe Siu Po L
Bought by
Tebbe Mark G and Tebbe Siu Po L
Home Financials for this Owner
Home Financials are based on the most recent Mortgage that was taken out on this home.
Original Mortgage
$368,000
Interest Rate
3.83%
Mortgage Type
New Conventional
Create a Home Valuation Report for This Property
The Home Valuation Report is an in-depth analysis detailing your home's value as well as a comparison with similar homes in the area
Home Values in the Area
Average Home Value in this Area
Purchase History
| Date | Buyer | Sale Price | Title Company |
|---|---|---|---|
| Tebbe Mark G | -- | None Available | |
| Tebbe Mark G | -- | Fidelity National Title |
Source: Public Records
Mortgage History
| Date | Status | Borrower | Loan Amount |
|---|---|---|---|
| Closed | Tebbe Mark G | $368,000 |
Source: Public Records
Tax History Compared to Growth
Tax History
| Year | Tax Paid | Tax Assessment Tax Assessment Total Assessment is a certain percentage of the fair market value that is determined by local assessors to be the total taxable value of land and additions on the property. | Land | Improvement |
|---|---|---|---|---|
| 2025 | $3,871 | $360,457 | $199,334 | $161,123 |
| 2024 | $3,871 | $353,390 | $195,426 | $157,964 |
| 2023 | $3,827 | $346,461 | $191,594 | $154,867 |
| 2022 | $3,559 | $339,668 | $187,837 | $151,831 |
| 2021 | $3,498 | $333,008 | $184,154 | $148,854 |
| 2020 | $3,466 | $329,596 | $182,267 | $147,329 |
| 2019 | $3,403 | $323,135 | $178,694 | $144,441 |
| 2018 | $3,345 | $316,800 | $175,191 | $141,609 |
| 2017 | $3,284 | $310,589 | $171,756 | $138,833 |
| 2016 | $3,226 | $304,500 | $168,389 | $136,111 |
| 2015 | $3,174 | $299,927 | $165,860 | $134,067 |
| 2014 | $3,129 | $294,054 | $162,612 | $131,442 |
Source: Public Records
Map
Nearby Homes
- 2542 Poli St
- 3124 Grove St
- 505 Briarwood Terrace
- 2418 Lexington Dr
- 2407 Sunset Dr
- 69 S Seaward Ave
- Plan D at Portalvo - Townhomes
- Plan F at Portalvo - Townhomes
- Plan E at Portalvo - Townhomes
- Plan O at Portalvo - Condos/Flats
- Plan A at Portalvo - Townhomes
- Plan H at Portalvo - Condos/Flats
- Plan L at Portalvo - Condos/Flats
- Plan C at Portalvo - Townhomes
- Plan B at Portalvo - Townhomes
- Plan J at Portalvo - Condos/Flats
- Plan G at Portalvo - Townhomes
- Plan N at Portalvo - Condos/Flats
- Plan K at Portalvo - Condos/Flats
- Plan M at Portalvo - Condos/Flats
- 359 Homer Ave
- 375 Homer Ave
- 380 N Brent St
- 374 N Brent St
- 2945 Mckinley Dr
- 362 N Brent St
- 383 Homer Ave
- 396 N Brent St
- 354 N Brent St
- 376 Homer Ave
- 399 Homer Ave
- 404 N Brent St
- 2967 Mckinley Dr
- 388 Homer Ave
- 2940 Mckinley Dr
- 396 Homer Ave
- 2800 Mckinley Dr
- 381 N Brent St
- 373 N Brent St
- 389 N Brent St